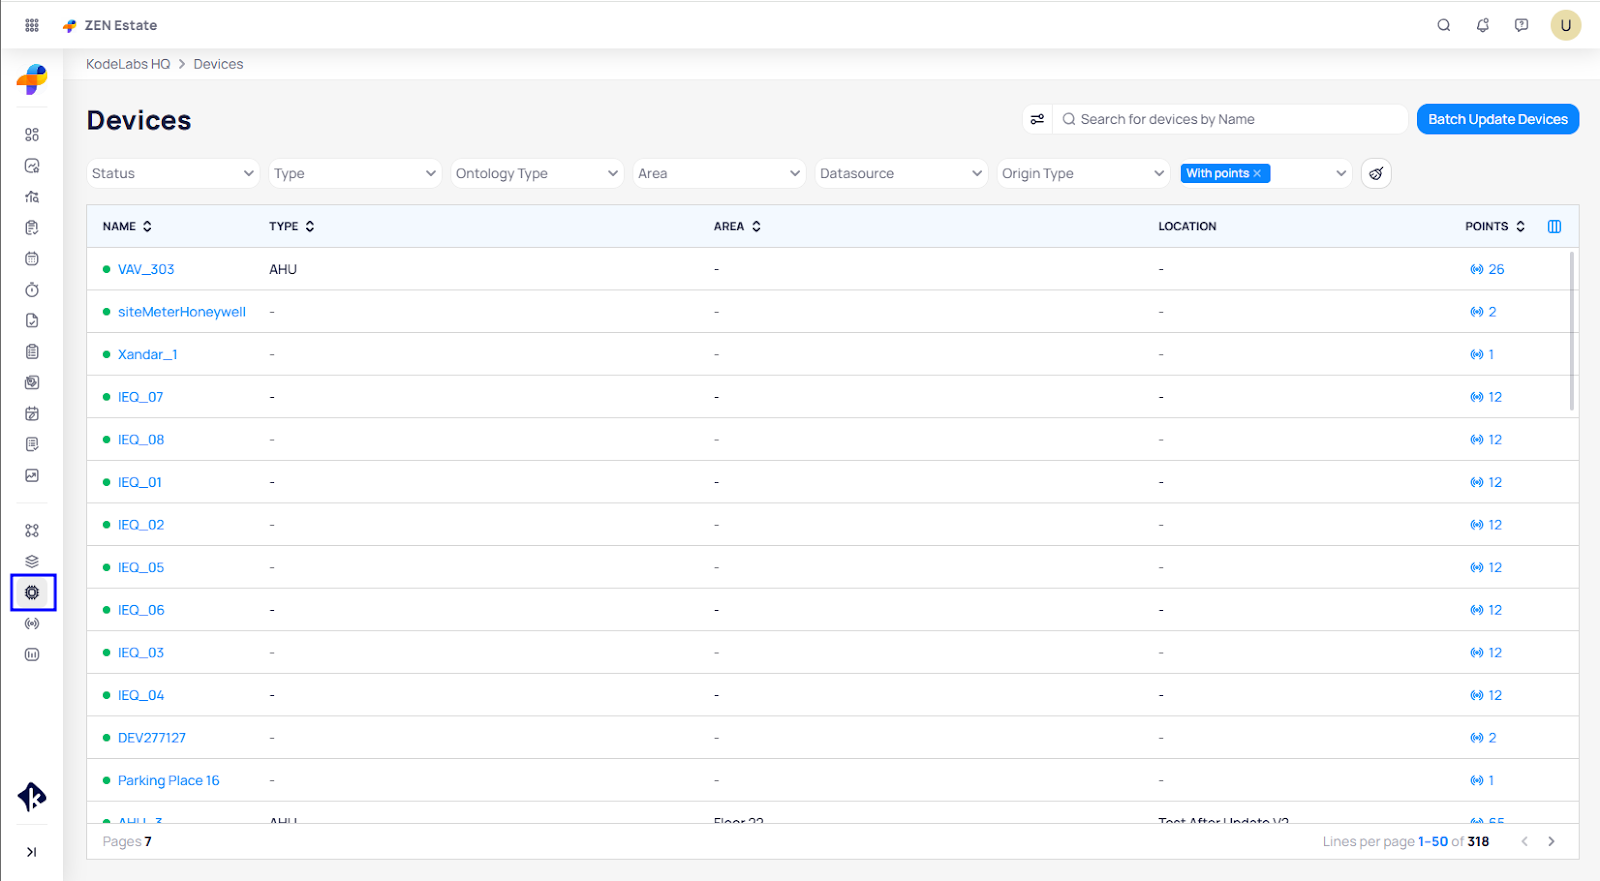
Devices
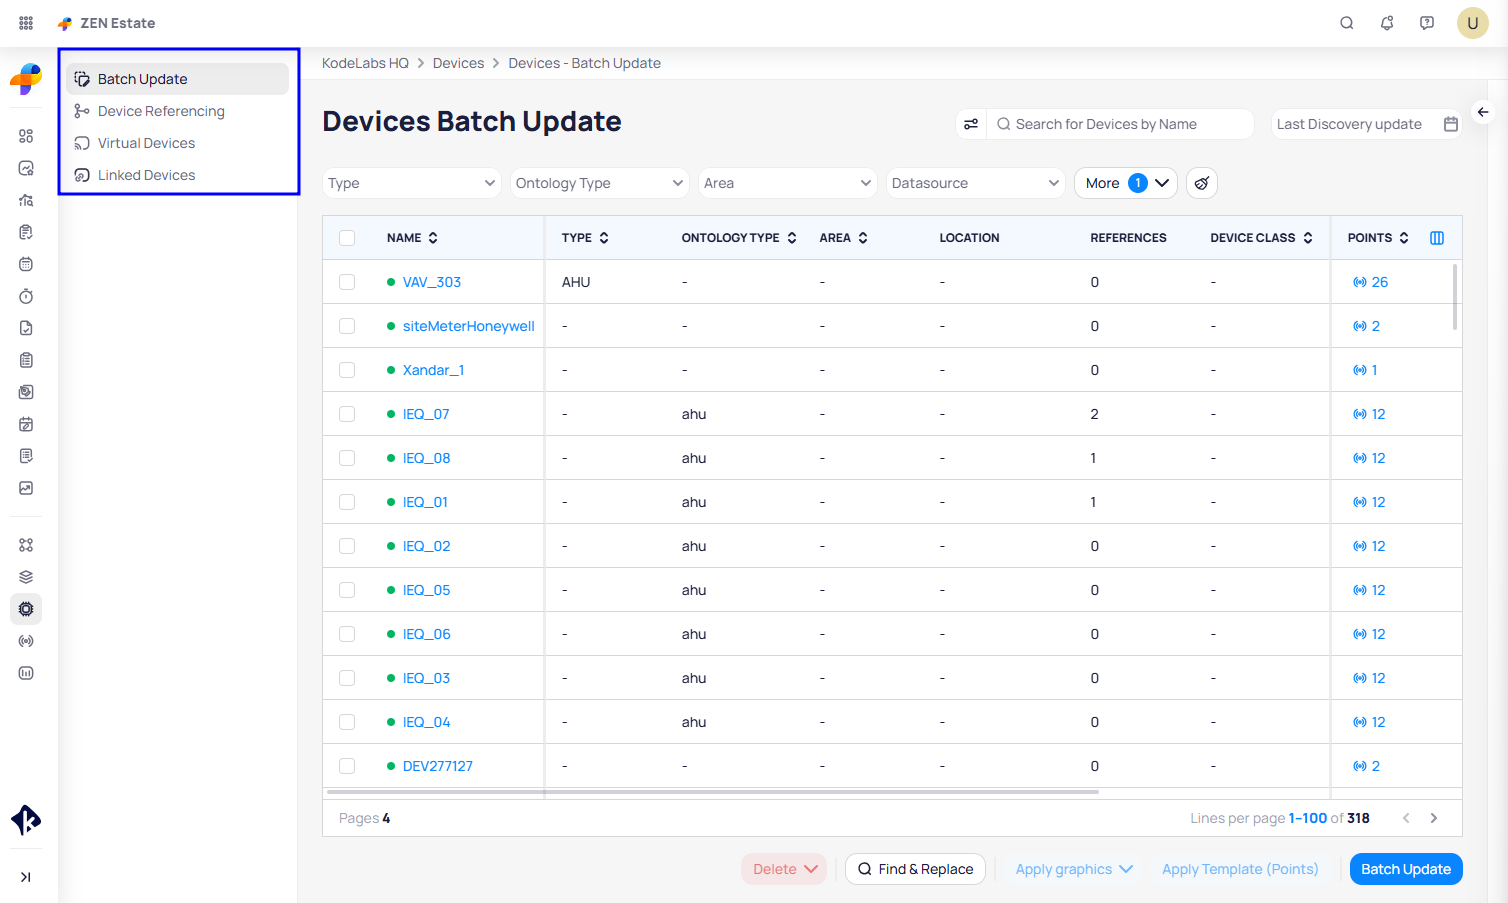
Devices Batch Update - Here you can update devices in a batch by selecting their type or area.
Virtual Devices - On this option you enter the virtual devices where you can view and manage the virtual
devices you create or want to create.
Linked Devices - Here you can see devices that are linked with the devices from myMSI.
Navigating through Device Details
Device Details helps you to determine device performance, status, history and allows you to interact with devices in order to adjust their functioning with the aim of increasing optimum performance.
There are a few ways on how you can get to device details:
Via the Site Menu go to your Building > Devices > Select Desired Device > Device Details
(the same can also be achieved via floor plans)
Searching for a device by its name via the Search Function and selecting it will take you directly
to its Device Details page
Via the Site Dashboard > Areas > Select Floor > Click on Device Name > Device Details
Using Device Details
In both ways you will reach the device details page which is divided into three main sections:
Points of the devices
Charts - device history
Right hand sidebar
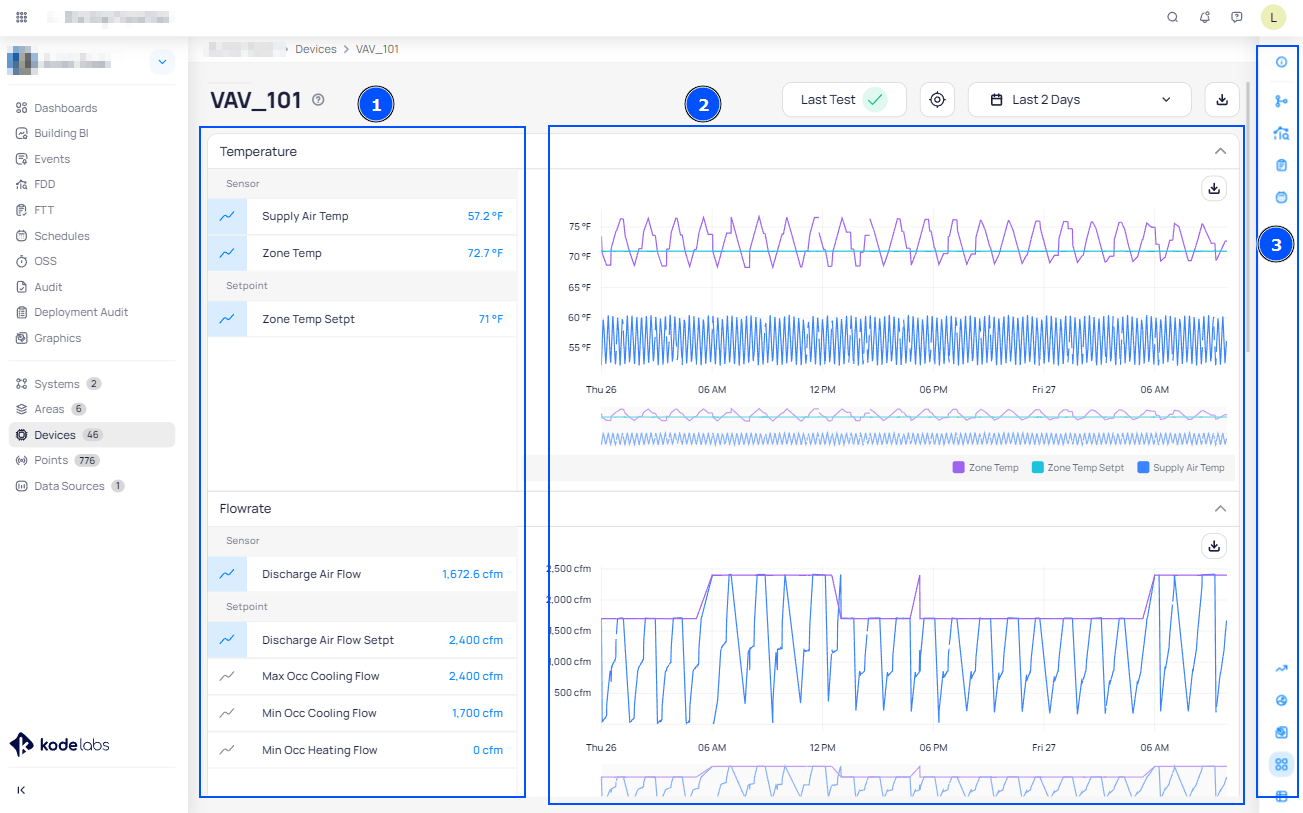
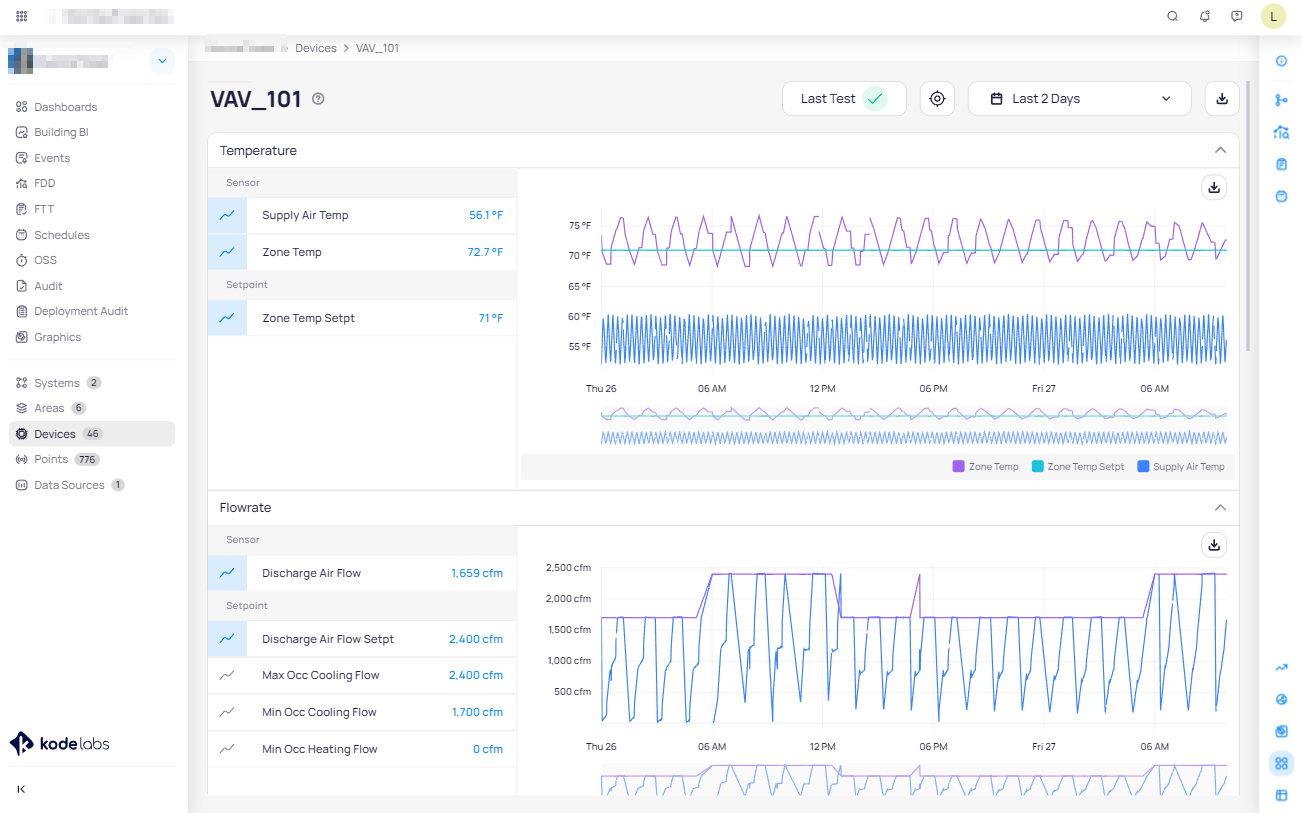
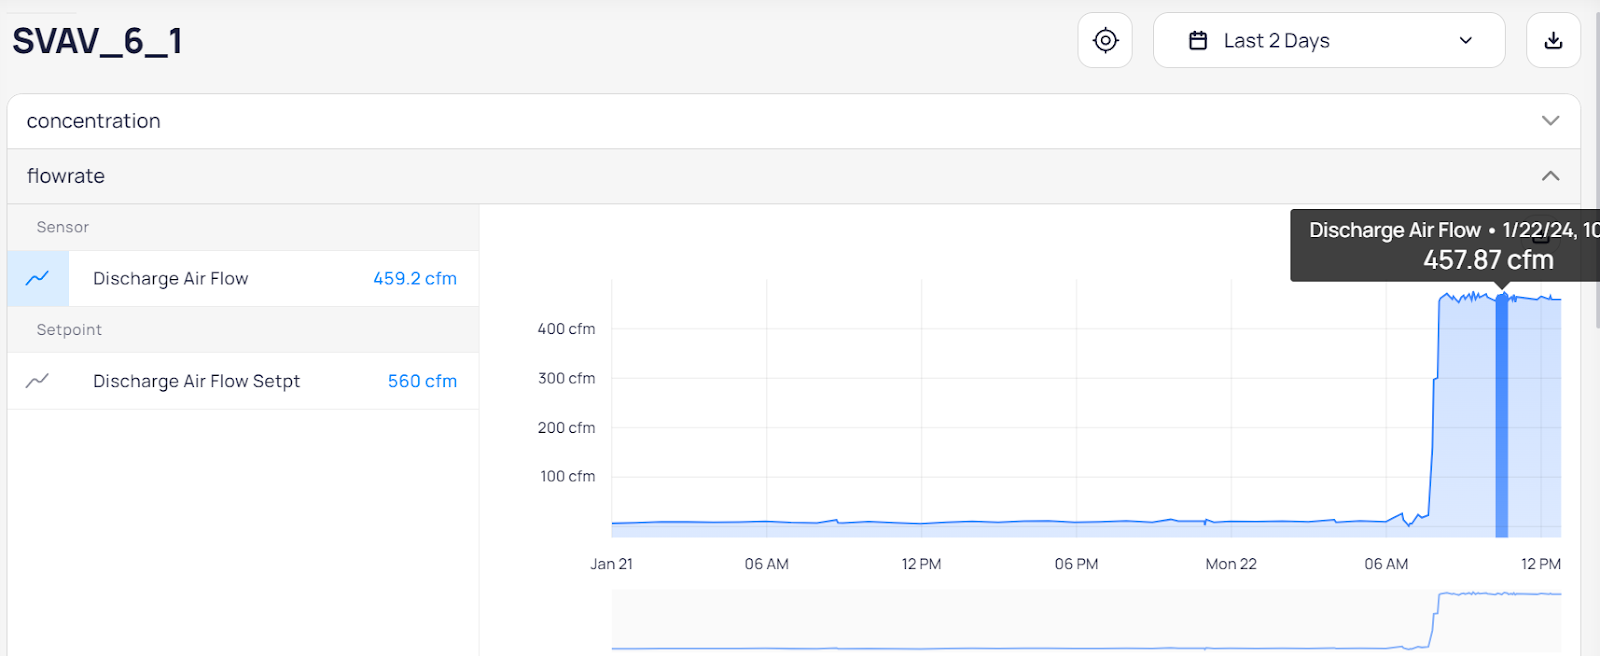
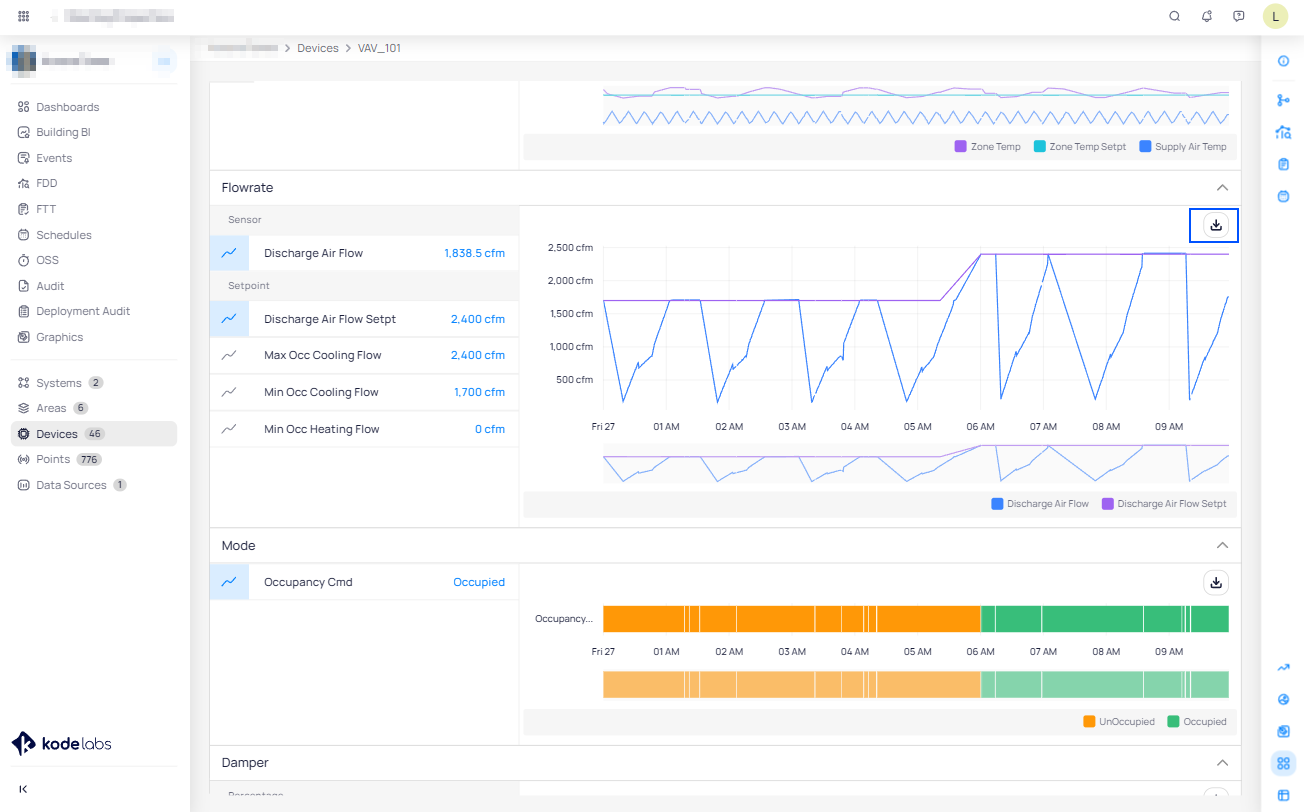
In the left section you will see all points grouped by type (e.g Concentration, Pressure, Fan) and represented visually. You can turn the visualization on or off by selecting the button on the left side of each point. Upon enabling, the visualization will show a trend of the point depending on the type of the point (i.e. graph, boolean, etc.)
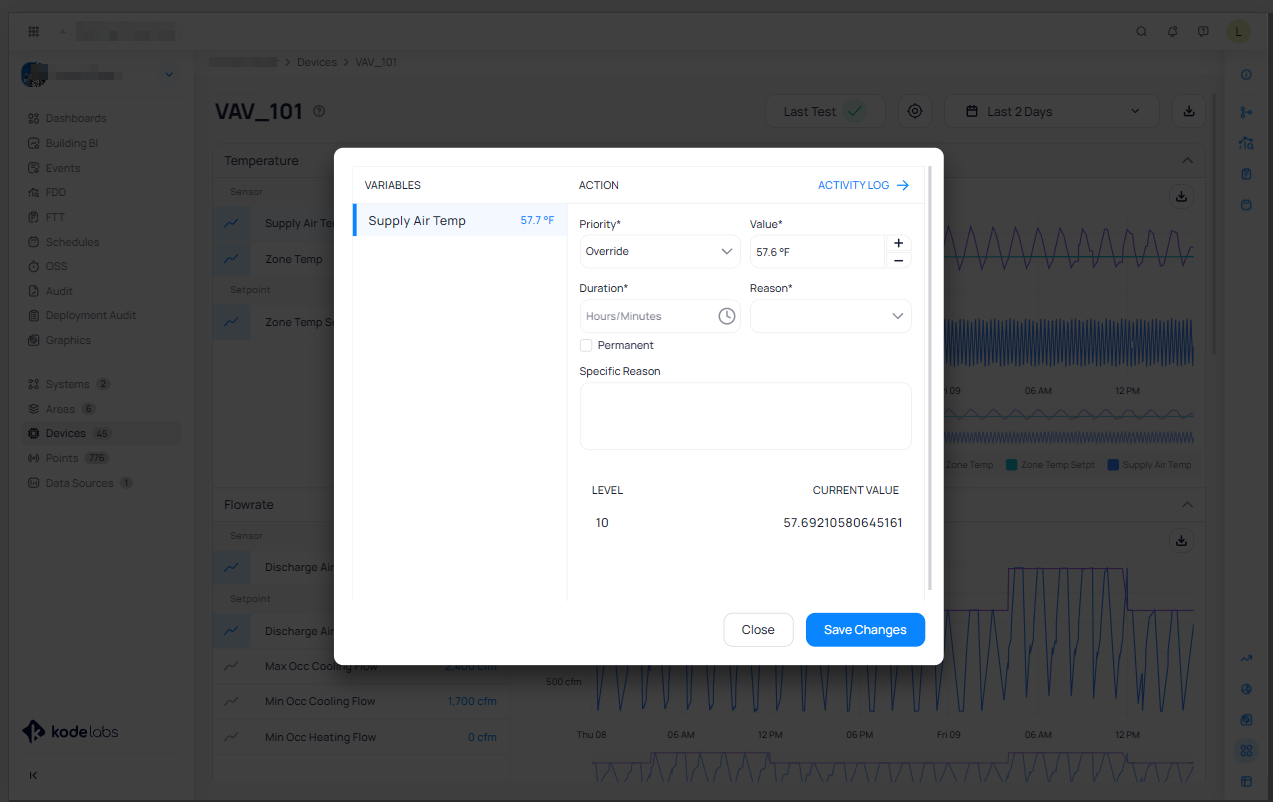
Hovering on points it will show a write icon on its right side.
Selecting it (clicking over the point name) will take you to the Write Point menu where you can modify the values based on your preferences.
Device History
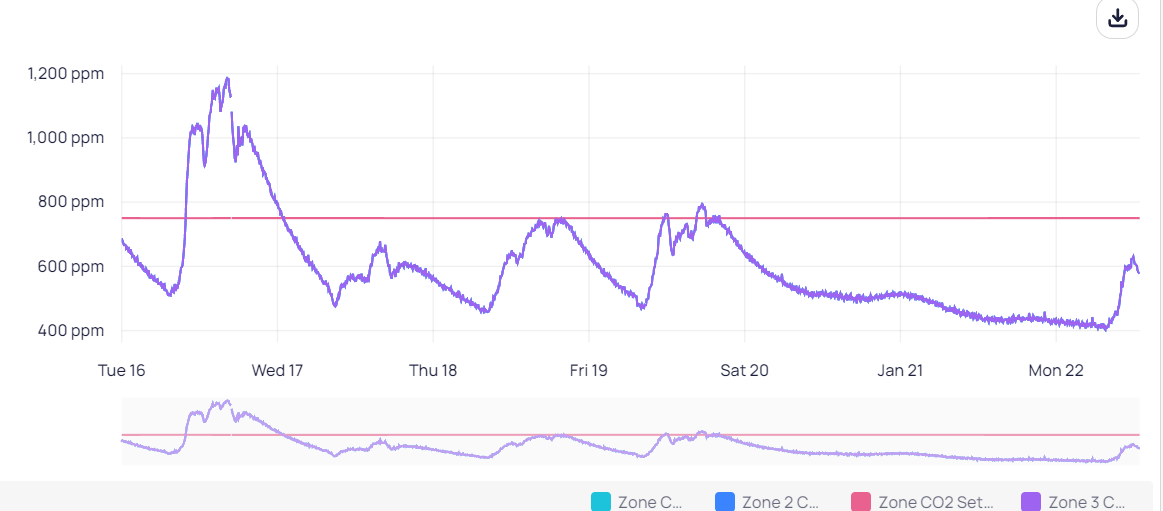
History will show a historical performance of the selected device. For example in the case of a HVAC device it will show the temperature history. The default time period to view the history is 2 days; however, this can be modified to longer and shorter lengths in the upper right hand corner of history.
In cases of temperature history, Outside Air Temperature can also be selected in order to show it in comparison with the temperature values provided by the device.
Hovering upon the chart will show you the name of the point, its value as well as the exact time for the given value.
Right hand sidebar
The right sidebar inside of device details has multiple options including:
Device Information - Here you can see all relevant device information including edge device,
building, area, location, device name, type, tags, and reference
References - References will show the associated devices to the selected device.
Attachments - Here you can add notes and upload attachments related to the device.
Active Events - View and manage all active events related to the selected device.
Dashboard View - View Device Details categorized by point type as determined by the device itself.
Exporting Charts
Navigate to Device Details through the steps mentioned in the first part of this article.
Click on the export button on the upper right hand corner of the chart.
For exporting you can select between PDF and image views.
Note: PDFs are preferred as standalone documents whereas image views are appropriate
if you need to integrate them into an existing document, presentation, etc.
Basic View
You can also switch to the dashboard view by using the button in the lower right corner In the dashboard view .
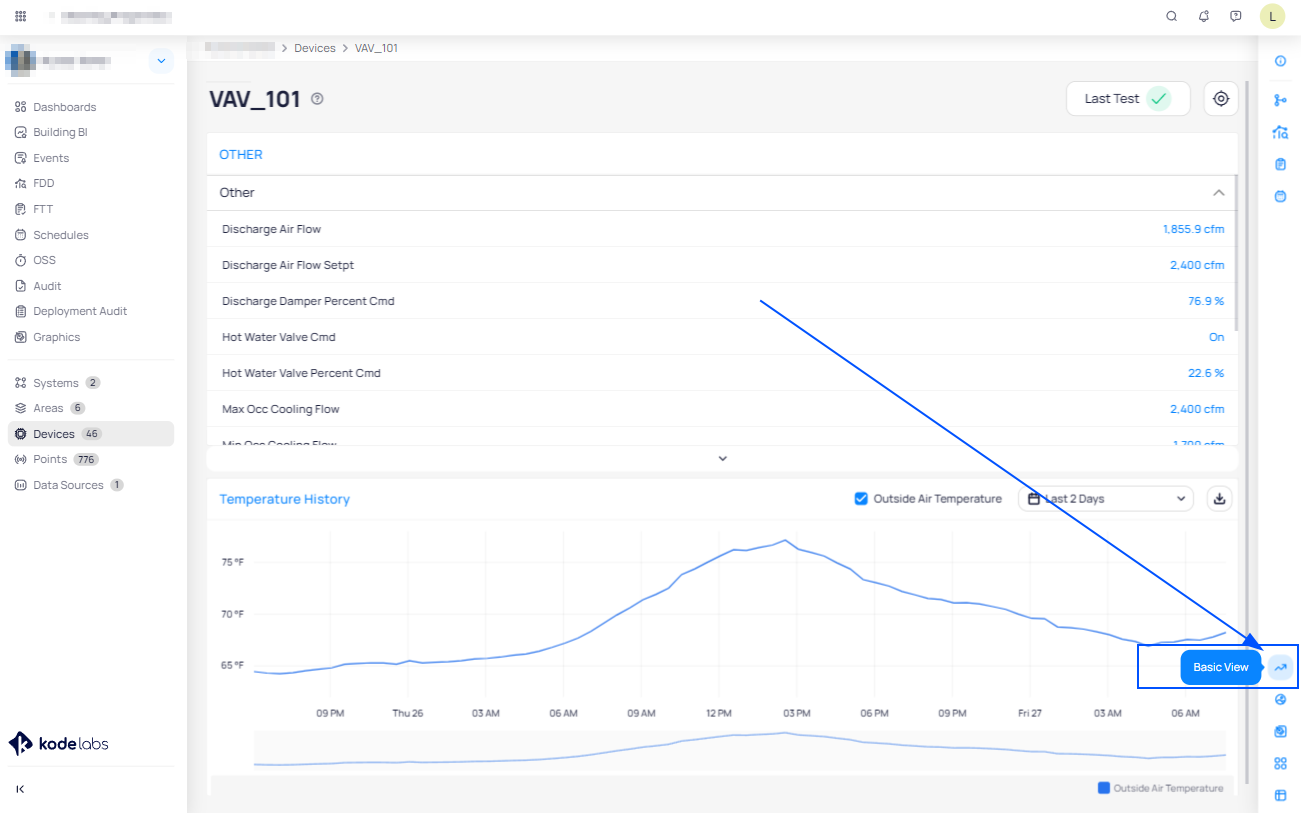
Basic View of the device details page is divided into three main sections:
Inputs, Variables, and Outputs for the selected device
History (if applicable)
Temperature History (if applicable)
Right hand sidebar
In the first three quadrants named Input, Variable, and Output, the users can interact with the device, see its actual values which are shown through sensors as well as device points status.
Inputs represent the values and feedback from physical or network connected sensors
(i.e. temperature, current, status, etc.)
Variables are the options that you can change to your desired settings (i.e. setpoints).
Outputs control and display the device behavior that changes per our set variables.
Device Export
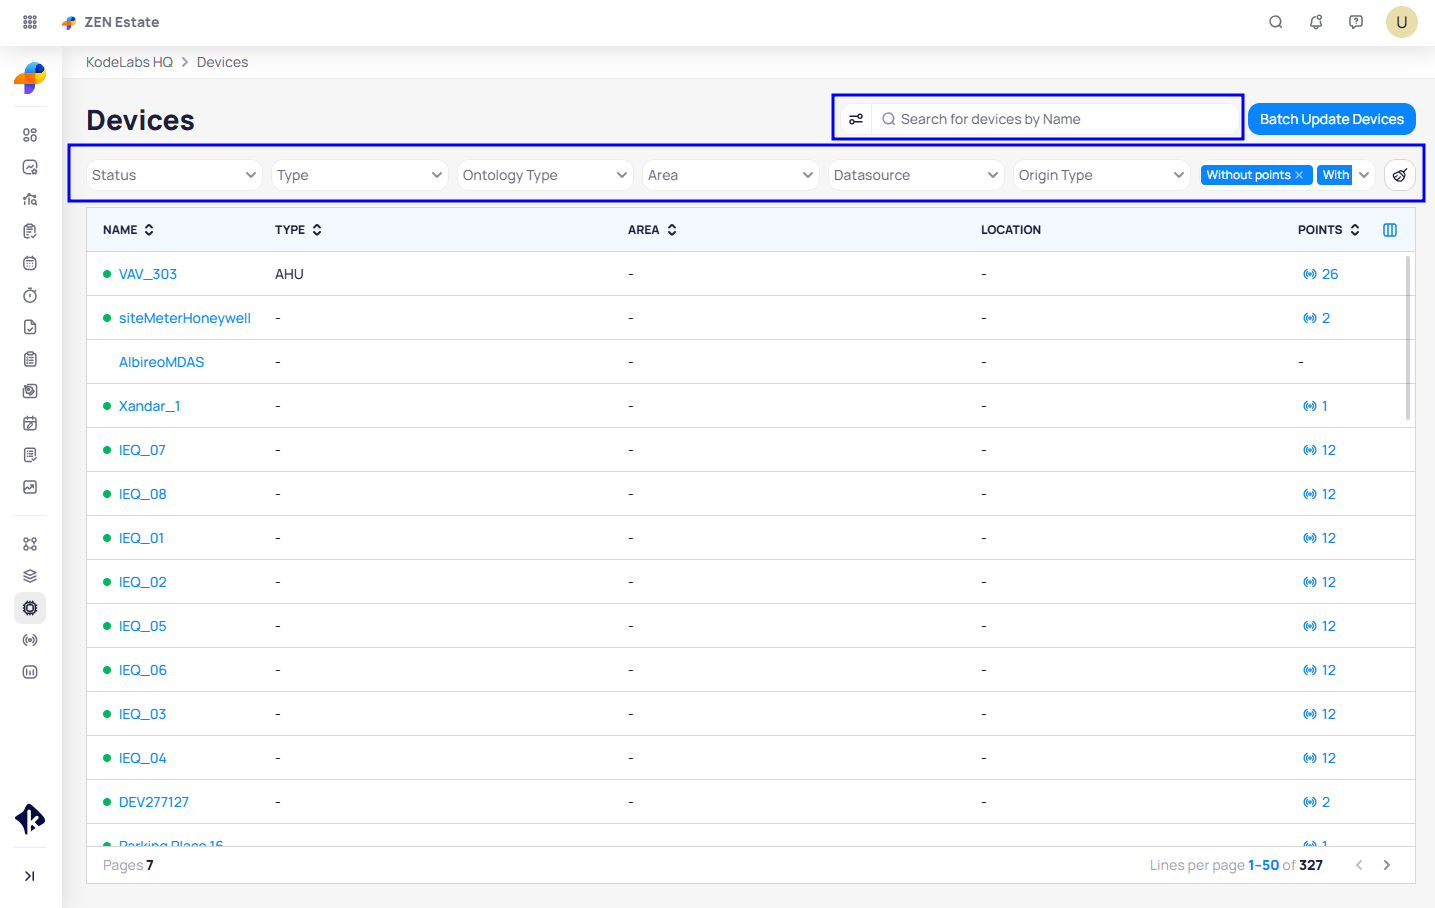
On the Device page, you’ll find an Export option in the top-right corner.
When you click the Export button, two actions are available:
File name – You can enter a custom name for the exported file.
Column selection – By default, 7 columns are selected. You can click to see additional column options and include more if needed.
You can use the available filters: Device Status, Type, Ontology Type, Area, Datasource, and Device Origin Type to narrow down the devices of your choice.
Once filtered, click on Export and then hit the blue Export button.
On the bottom-right side, under the Activity Log, click on Download.
The file will be saved to your computer in CSV format.
Device Graphic is a powerful tool for visualizing your building's HVAC system in real time. It allows you to monitor and control your AHU, VAV, and HVAC devices and their components, all from a single interface.
Overall, Device Graphic is an essential tool for building management professionals who want to keep a close eye on their HVAC systems. With its intuitive interface and powerful features, it is the perfect solution for anyone looking to improve the performance and efficiency of their building's HVAC system.
Navigate to Device Graphic
To get started simply navigate to device details. You can get to the device details in a few ways:
Via the Site Homepage > Devices > search and select the desired Device from the device list.
When you search for a device by name and select it, you will be taken directly to its Device Details page.
The search function can be accessed by clicking on the search icon in the main navigation bar on the left.
Via the Site Dashboard > Areas > Select a Floor > from the floor plan graphic click on Device Name
(the same can also be achieved via system graphic).
To access the Device Graphic View, click on the Graphics icon at the bottom of the right sidebar. Here, you will see a graphical representation of your building's HVAC system, with each device and component represented by a distinct icon.
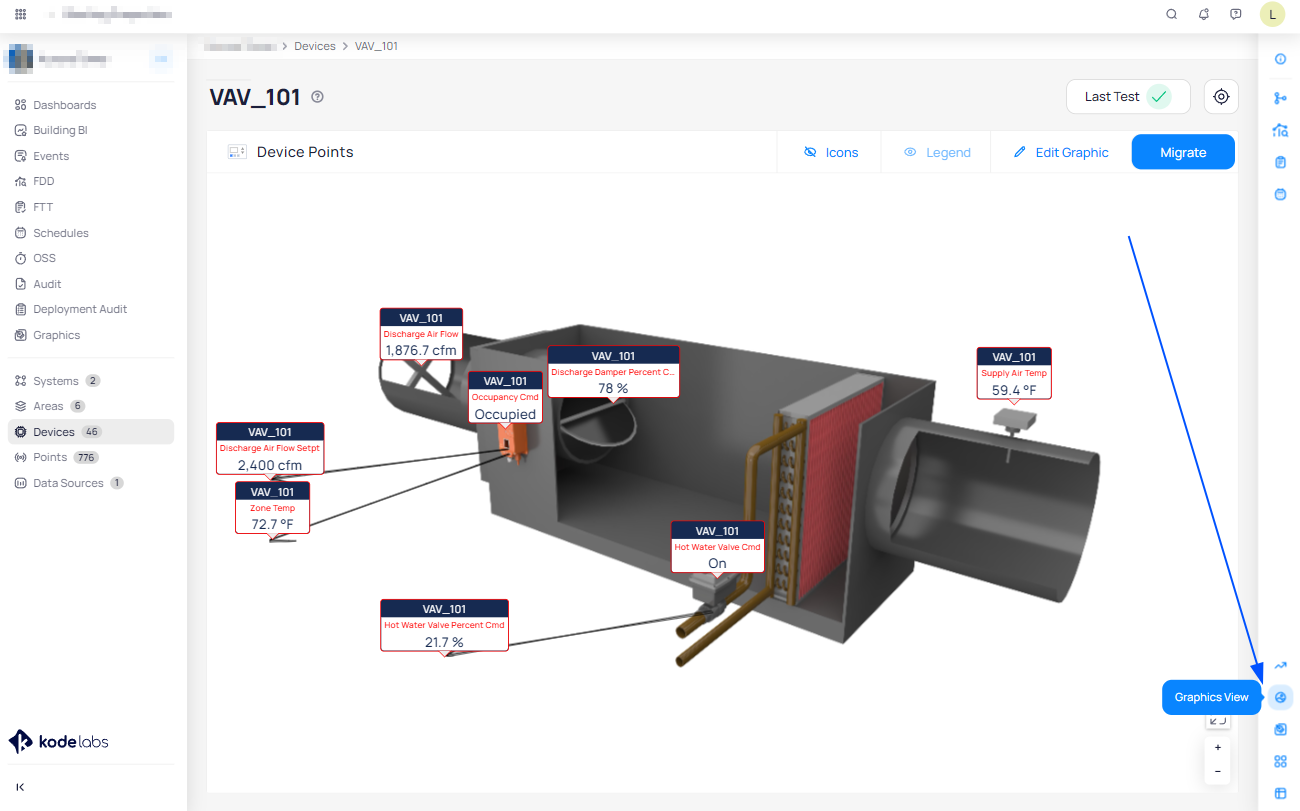
Review and Monitor points from Device Graphic
In addition to monitoring your devices, you can also use Device Graphic to control them. Simply click on the relevant icon to bring up the control panel, where you can adjust settings such as temperature, fan speed, and more.
To review and monitor AHU, VAV, and HVAC devices performance from Device Graphic tool, follow these steps:
Log in to your account and navigate to the Device Graphic dashboard.
Look for the AHU, VAV, and HVAC devices on the graphical representation of your building's HVAC system.
Review the device's current status, temperature, pressure, and other important metrics to get a sense
of its performance.
Use the historical data and trend analysis features to track performance over time and
identify any issues or inefficiencies.
Set up alerts and notifications to be notified of any significant changes in performance,
so you can quickly address any problems.
Use the control panel to adjust settings and optimize performance if necessary.
Configure Device Graphic
Upload Device Graphic
By uploading a Device Graphic, you can create a custom visualization of your building's HVAC system that is unique to your needs. This will make it easier to monitor and control your system in real time, improving its performance and efficiency.
To upload Device Graphic, follow these steps:
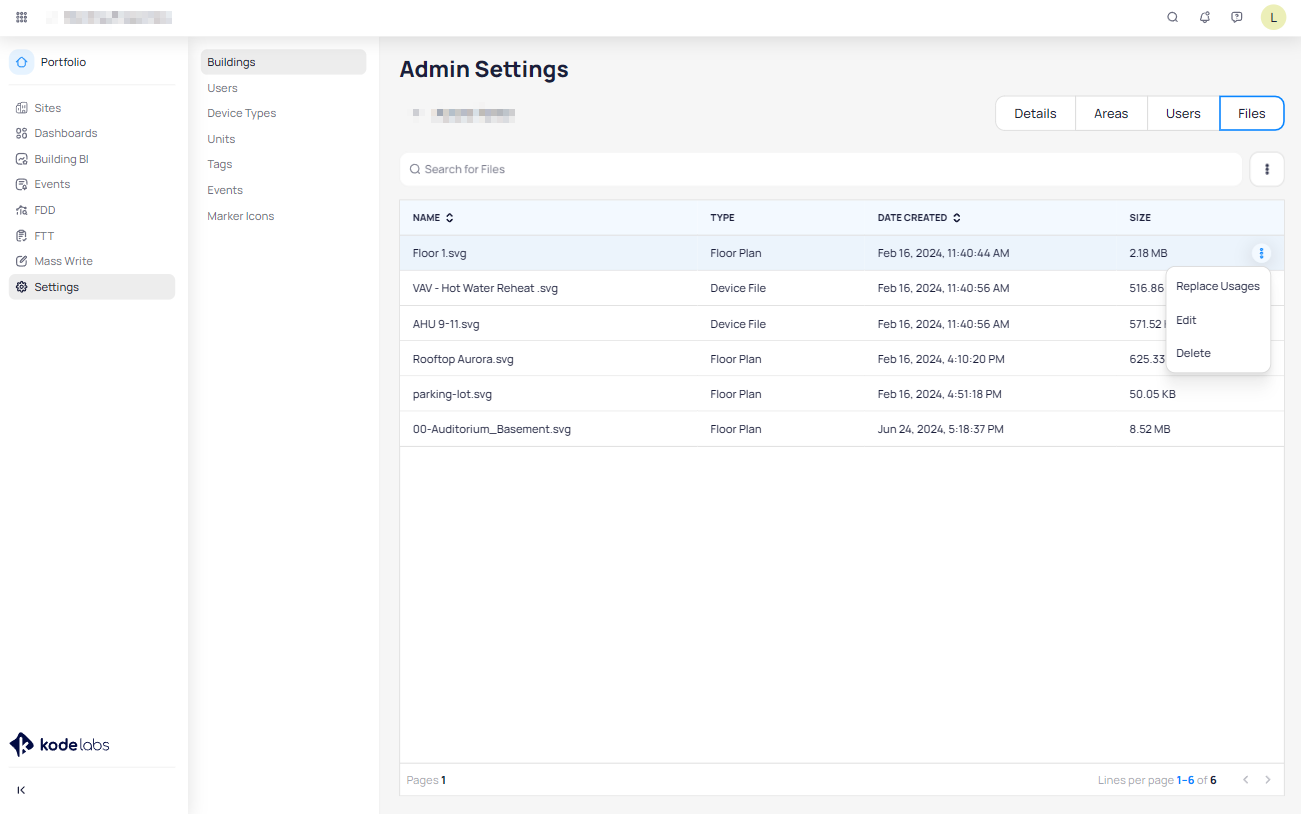
Navigate to the Admin module from the left main navigation bar > Buildings > choose a building > Files.
Click on the three dots at the top right of the Files page > from the dropdown menu select + Add Device File.
Select the file you want to upload from your computer. The file should be in a compatible format, such as
a PNG, JPEG, or SVG.
Wait for the file to upload. This may take a few moments depending on the size of the file and the speed
of your internet connection.
Use the 3 dots icon far next to each uploaded file to update the name of the uploaded graphic or delete it
or to replace the file.
Add a Device Graphic
To add a device graphic on device details follow the below steps:
Navigate to device details via the Site Homepage > Devices > search and select the desired Device
from the device list.
To access the Device Graphic View, click on the Graphics icon at the bottom of the right sidebar.
From the Graphics View click on the "Apply Template" or “+ Create New'' button.
Selecting the "Apply Template" option you will have the chance to choose any saved device graphic template (the Device Graphic File and all the selected points/icons).
Selecting the “+ Create New'' option you can create a new device graphic from scratch.
From the “Choose File” pop-up window select the Device Graphic File, uploaded on the Admin section.
Place the points/icons on the graphic in the desired location.
Use the "Save" button to save your changes and exit edit mode.
By adding new points and icons to Device Graphic, you can customize the representation of your building's HVAC system to better reflect its unique layout and devices. This will make it easier to monitor and control your system in real time, improving its performance and efficiency.
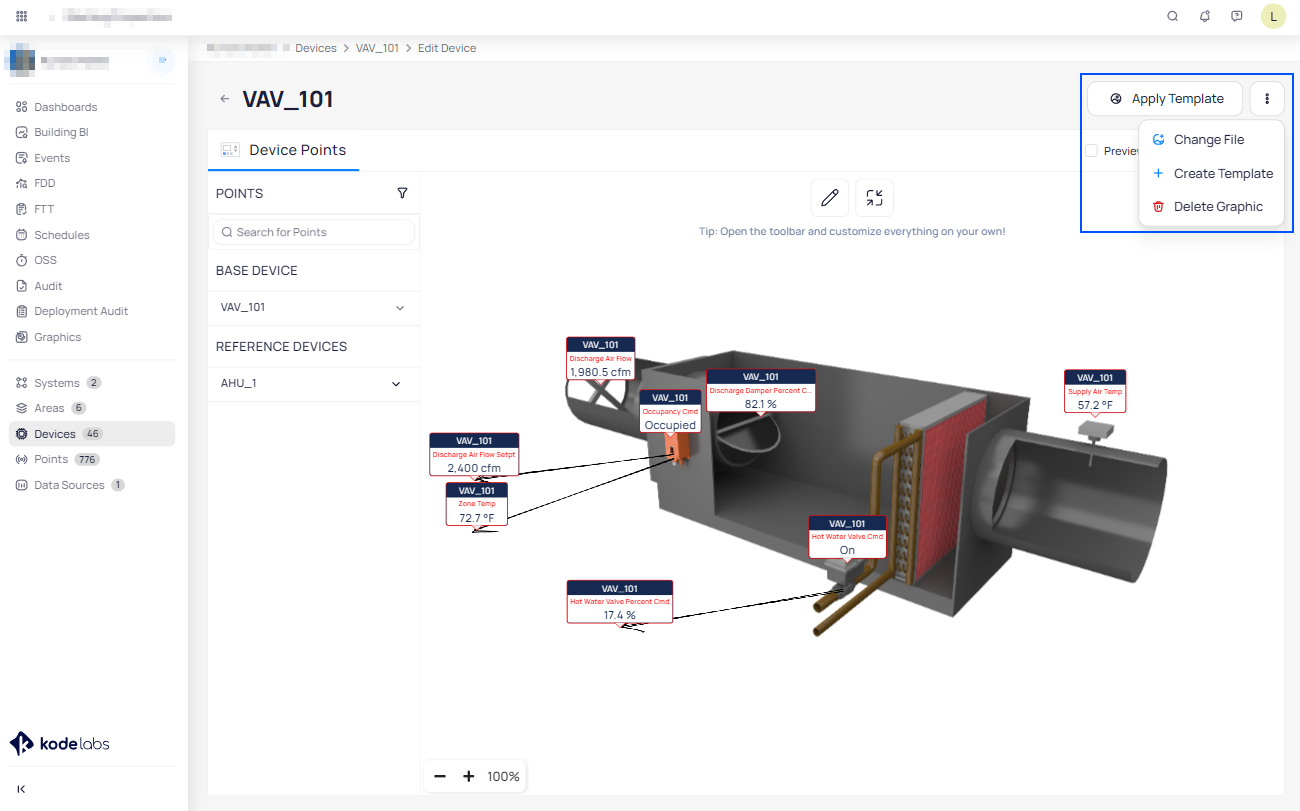
Edit and Add Points to the Device Graphic
To edit the Device Graphic and add points and icons, follow these steps:
Log in to your account and navigate to the Device Graphic dashboard.
Click on the "Edit Graphic" button to enter edit mode.
Clicking on the 3 dots icon at the top right of the screen on the drop down you will see three options:
Change File - from here you can change the device graphic file.
Create Template - from here you can create a template using the file you have uploaded and the
points you have chosen.
Delete Graphic - from here you can delete the uploaded device graphic.
On the left side of your screen you will see the list of all Referenced Devices.
Drag points or devices from the list on the left to add new points and icons to the graphic.
You can zoom in to get more precise.
You can modify the placement of the device/point by dragging on the marker triangle.
Select the type of icon you want to add from the available options.
To learn more about Icons and Graphic Tool check this article here.
Click on the marker or icon to customize the appearance and settings of each point and icon, such as its name,
color, size, and associated data.
Use the "Save" button to save your changes and exit edit mode.
Why are my devices down?
Where do I view my down devices?
Navigate to the Network Status widget on the building dashboard.
The yellow bar shows down devices, hovering over it will show you the number of down devices.
Clicking on the yellow bar will display a list of down devices.
What action should I take to resolve this?
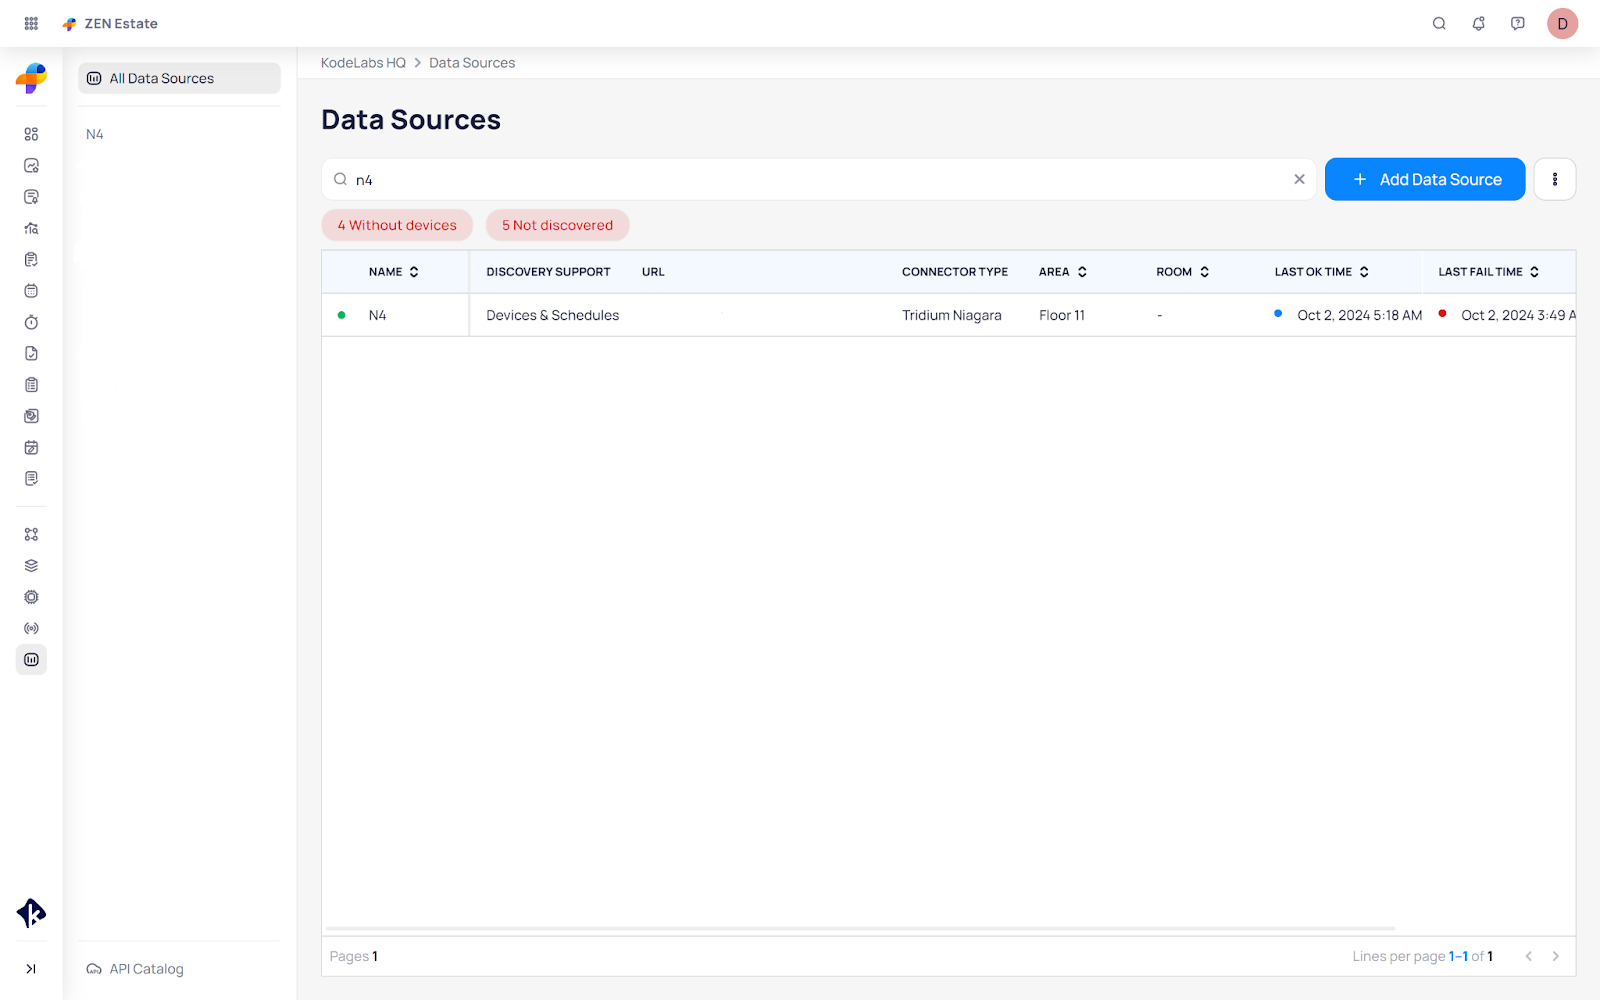
If devices are down in the platform but online in the Jace.
Click into Data Sources from the main sidebar and you will see a three dots button on the page that opens up.
Click on the three dots button and click on the Refresh Cache option.
This will refresh your cache and bring the device back up.
The device should now be back up on the platform.
If devices are down in the platform and down in the Jace
Please, contact your temperature controls service provider to investigate the communication failure
with the devices.
Provide the list displayed from the Network Status widget to your services provider.
What are common causes for down devices?
Network issue
Poor RS485 BACnet MSTP installation
Failed controller (local device)
Additional resources
Related Articles
Virtual Devices Module
Accessing Virtual Devices To access the Virtual Devices page: Navigate to Devices. Click Device Batch Update. Select Virtual Devices from the left side menu. Creating and Managing Pseudo Devices Initially, devices might not appear as PseudoDevices ...Devices & Points Sheet Import
Overview Excel Upload — Device Discovery enables deployment teams to import devices, points, metadata, and ontology mappings into KODE OS using a structured spreadsheet before live data source connectivity is available. This feature is designed to ...Linked Devices
To link devices that you have discovered in KODE OS and added in myMSI as well, follow the below instructions: Click on Devices at the site you need to link devices Go to Batch Update Devices button places on the top right corner Click on Linked ...Virtual Devices
We use Virtual Devices to separate grouped systems and devices. Virtual Devices can divide a single device into multiple parts for better use. Note: Devices should be tagged with PseudoDevices in order to be part of the Virtual Devices. How to tag a ...Devices - Batch Update
The purpose of tagging is to correctly assign the appropriate components to each piece of equipment. Follow the steps below to tag your devices. Navigate to a building of your choice through the Sites feature in the left navigation bar. Click on ...