What is included
There’s a graphics builder we’ve been cooking that gives you the ability to build System and Device Graphics and customize floor plans with additional functionality that outperforms any other graphic tool in the industry.
Smart Markers - Smart Markers provide for dynamic features and logic to be added to the marker configuration, such as color-coded point ranges, adding greater value within graphics pages..
The rules and ranges of how the marker will get colored are handled in the Settings page
For each marker we can pick a point and a config
Display functionalities:
Icon only - the marker will show as an icon and be colored to reflect its current value
Value only
Icon and the value
Tables - Easily create a table in a few clicks! Table views that list the points from certain devices can now be included in floor, device and system graphics.
The table is created simply by picking the device and the points we want to show
The table is a single element, so updating or moving it is very simple
The user can pick points from multiple different devices to show on the table
This version only supports two columns, point name and value
Control styling such as colors, column width, font sizes, etc.
The style of all the tables in a graphic can be edited in batch
Zone drawings & control - Draw zones, choose which devices will control the zones, and how they will be colored. Now you won’t have to hard code them and you’ll be able to configure everything in the Graphics module.
Pick which devices will control a Zone’s color; only the devices placed within the borders of the zone can be chosen
Pick the point which will control the zone – the common point of all markers on that zone
If the point is boolean/enum
The operator is either AND or OR
AND applies the 'and' operator on all the point values
OR is the same, the 'or' operator is applied
If we want to make the zone color yellow when the light status is On:
“AND” means all the values from all devices on that zone should be On in order for the zone to get yellow color
“OR” means if any of the point values in the zone is On, the zone will get yellow
If the point is number
The operators are AVG, MIN, MAX, SUM, MED
This operator is applied to the point values
So if we want to set a zone as green if the values are between 22C and 24C and apply the AVG operator, then the average value of all the points within that zone has to be within this range
The same applies to other operators
After we pick the operator, we can chose the States
The State determines what color the zone will get based on the point values
For number points we can set ranges or other comparisons such >, <, = etc.
For boolean/enum points we simply pick the values and set the color
Each zone will have a default color which will display if the values do not fall within the State rules
The current version only supports one point reference per zone
Hover-over markers - The “Hover-over” feature allows users to reference multiple points in the marker, but only show one by default. The other points will show when the user hovers over it. This functionality can be used for Smart Markers and default markers. Also, you can hide marker headers or labels and on the hover they will show. When used with Smart Markers, this functionality allows users to see the Device name and navigate to Device Details.
System Markers -System Markers act as links, providing easy navigation between System graphics or from floor-plans to System graphics.
While editing a graphic, the user can switch between Devices and Systems in the left hand Elements menu
All Systems relevant to the site will be there and the user can simply drag and drop the System into the graphic to create system markers
System Drawings - In previous versions, users needed to upload an image that served as the system drawing. Modifying the drawing was impossible. Now with the new tool we can create and modify System drawings within KODE OS:
There is a library of drawing elements which the user can drag and drop to create a System graphic
Drawing elements are single components such as pipes, valves, pumps and other component parts of the system
Dragging components onto the graphic canvas will allow the creation of a System drawing
Grouping and other options allow for better usability
Creating a system drawing is separate from putting the markers on it, which can be done as a second step.
System Layers - With the new tool we will be able to add Layers to Systems too. This can make the system graphics better, for example:
The main layer might show only the most important points
The second layer can then have all other points and tables, System Markers linking to related systems, etc.
Effective use of System Layers will create a better user experience because the main layer won’t be overloaded with too much information.
Layer Configurations - Users are not limited when adding layers, and can create any layer they may want. To speed the process even more users can create layer configurations in the Settings page.
Layer configurations will serve the purpose of:Keeping consistency
Making the placement faster because we don’t need to pick the points, just the drop the devices on the view and points will show up according to the configuration
Layer configuration includes:
Name
Name of the layer, which can be changed on the graphic
Icon
The icon that will show up as the layer icon
Device type
Serves the purpose of filtering the devices while doing placements
Point field
Selected point(s) will show up when we drop a device on the graphic
So no need to expand the device and pick the point, we just drop the device and the point shows up
Smart marker
If we want for the markers to show up as smart markers, we choose a configuration of the Smart Marker
Smart Marker will show up if the selected point is available on the marker
Easy batch editing/moving/deleting - Simply batch-select the markers by dragging the mouse or clicking on them, and perform batch updates to the marker properties. It is no longer needed to edit the markers one by one. This will save a lot of time on floor plan or system configuration.
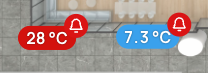
Show points statuses and states - Now the markers will highlight if the points have alarms or other states and statuses such as:
Alarm
Down
Fault
Stale
Overridden
The state will be represented by a color and an icon next to the point value. This icon will be enabled by default on smart icons.Elements alignment - This will allow you to align multiple selected elements on graphics with ease. Options that you have available:
Left
Middle vertically
Right
Top
Middle horizontal
Bottom
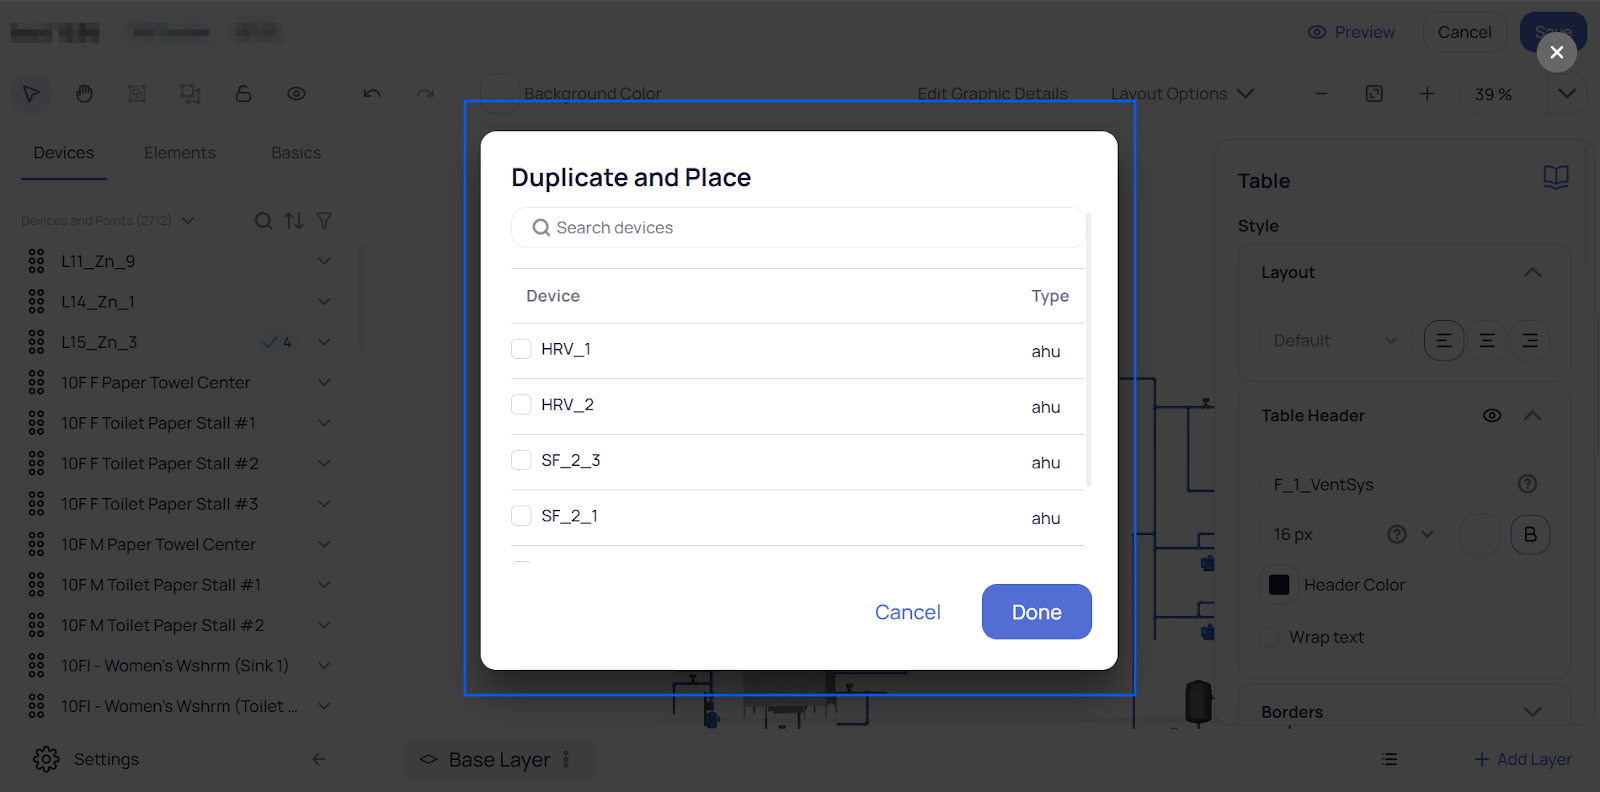
Duplicate and Change Device - Here you can select a table or smart marker and duplicate it in order to create multiple tables or smart markers in a faster and easier way. After you complete creating a table or marker for a device or system simply right click on it and proceed to Duplicate and Place.
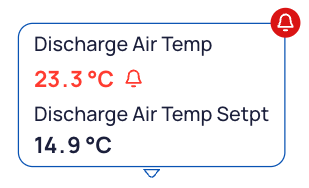
After clicking on it a new dialog will be opened with all the devices listed that are of the same type as the original one where the table or smart icon belongs. Here you can choose multiple devices if you want to create a similar table or smart icon with the same style and configuration as the selected one.Highlighting the setpoint value - You can highlight a wanted setpoint of your choice in order to make it more visible in a graphic manner. Simply click on the marker or on the table you want and enable the “Highlight Setpoint” option and here you can also choose if you want to highlight the “Point Label” or “Point Value”, or why not to highlight them both by selecting the “Label and Value” from the dropdown menu. You can add here a small icon before the name of the point and the value to make it more notable from the other rows so you can choose if you want to highlight the text with the value or adding this icon.
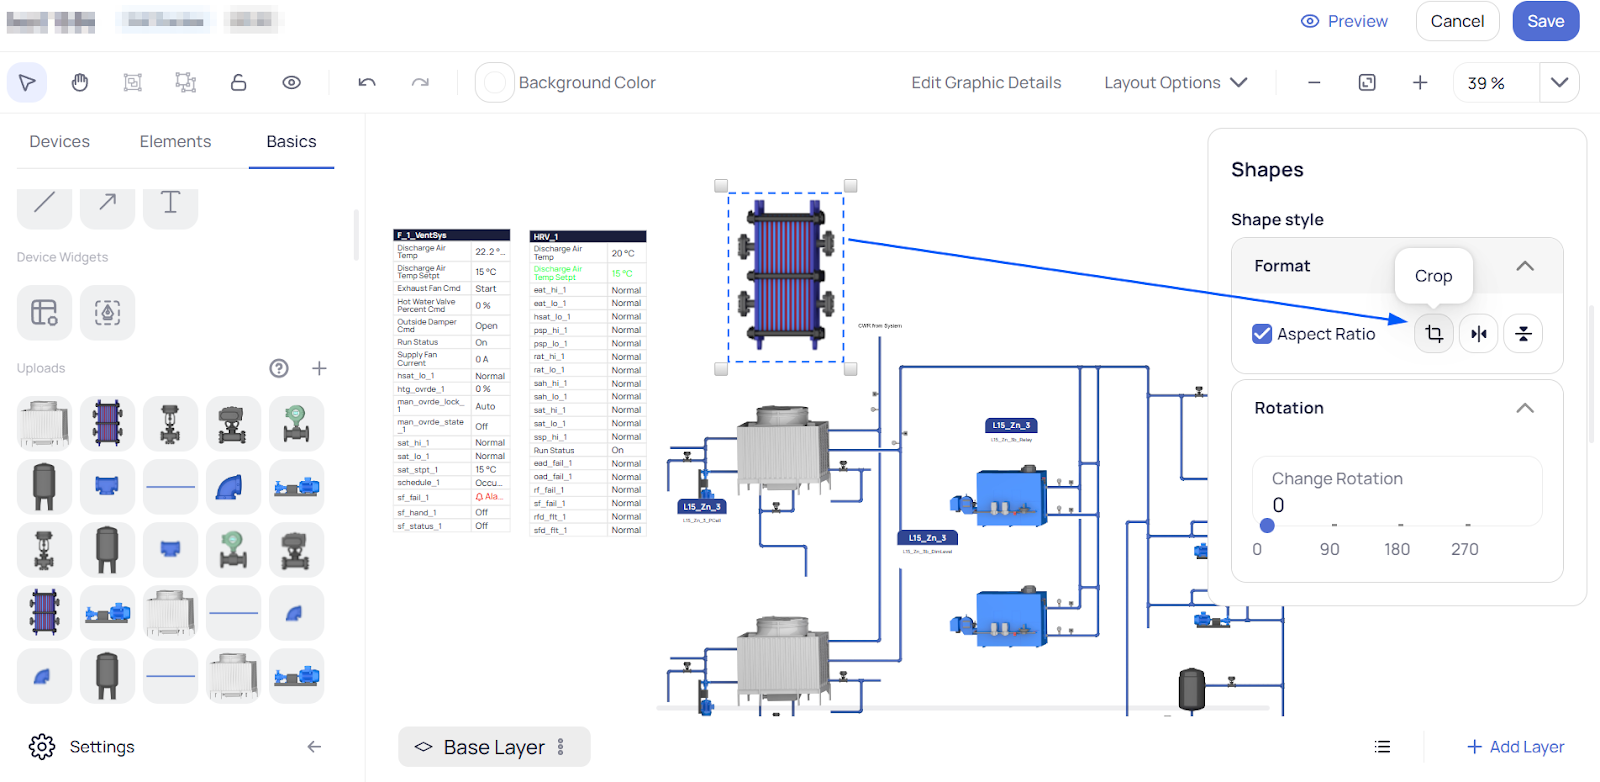
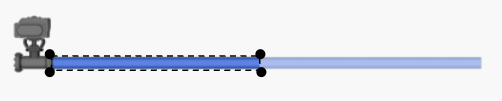
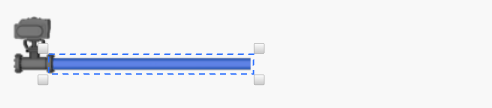
Also do not forget to choose the color!Crop the drawings - Now you have the ability to crop the drawings you uploaded or the elements from our library (excluding images added as a background such as floorplans or built up systems and devices). Simply when an object is selected you can go on the right side of the menu at the Shapes and choose the Crop option:
Click on it and the drawing or selected object will visually change to reflect that it is in a “cut” state.
Adjust the black circles to perform cutting. Hit “Enter” and there will be shown the left object after the crop.


Related Articles
Using the Energy Dashboard
Depending on your user privileges as well as company subscription, you may be given access to an additional module called Energy Dashboard which shows data for energy consumption (inclusive of power, water, steam, gas, etc.) at the building level as ...System Graphics
KODE OS now provides an innovative tool for creating System drawings with ease and efficiency. With this feature, users can effortlessly design intricate system graphics tailored to their needs. Simplified System Schematics Drag-and-Drop Library: ...Navigating through the Site Dashboard
The Site Dashboard is the main menu for a building which is displayed after selecting a desired building from the building cards on the map view. The menu is broken down and organized into widgets which represent a feature of KODE OS filtered for the ...Optimized Start Stop - OSS Adapter
KODE OSS starts your equipment at the latest possible moment to save runtime and energy while optimizing for comfort. OSS starts each device at the optimal time so that the zone temp is in range of the cooling and heating setpoint range at your ...