Using the Event Dashboard
KODE OS monitors the operational health of your equipment 24/7 via event routines which cover everything from fan command failures to zone temperature off setpoints. Through the Events Dashboard in KODE OS you can view all active and historical events across your portfolio.
To access site events, click on the "Portfolio" button situated in the top left corner. Search for the specific site, then proceed to navigate through the “Events” feature listed on the left. Here, you will find detailed information regarding events within the respective site displayed on the page.
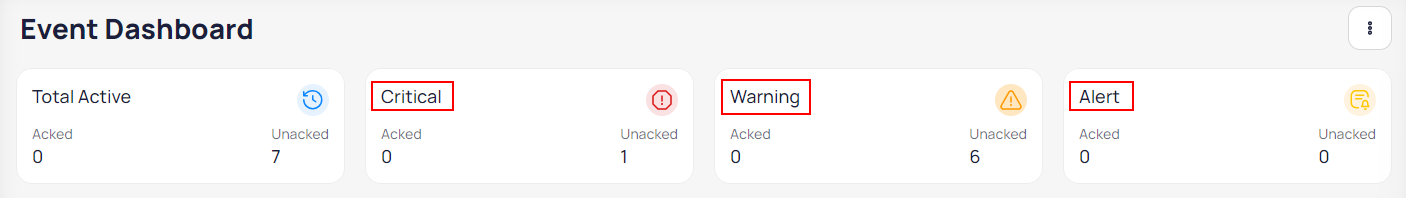
Events are categorized in three categories as follows:
Critical Events are those that are defined as having an immediate and/or severe impact to the building operations.
Warning Events are those that identify equipment inefficiencies or operational failures that may affect tenant/occupant comfort.
Alerts identify equipment inefficiencies that may cause potential energy inefficiencies.
Filtering and Finding Events
Selecting any of the available filters on a specific building will only display corresponding events in the list below. You can see that in each filter there is a number of events in parenthesis which shows the number of events that fulfill the criteria.
Filtering can be done based on
Event Category
Class
Type
Active or Inactive
Acknowledgement status
Ext. Communications
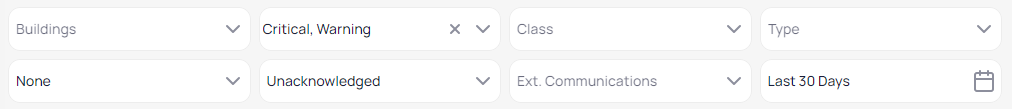
Furthermore, you can pick up the date of your liking to filter events on the events list below through the embedded calendar window.
Acknowledging an Event
An event, regardless of its category, can be acknowledged or unacknowledged. Acknowledging an event means that you have taken the responsibility to inspect the device and/or the system associated with the event and will ensure that it is resolved. You can acknowledge an event by selecting the box on your left side on the events list and saving them as acknowledged events.
Please see the screenshot below on acknowledging an event.
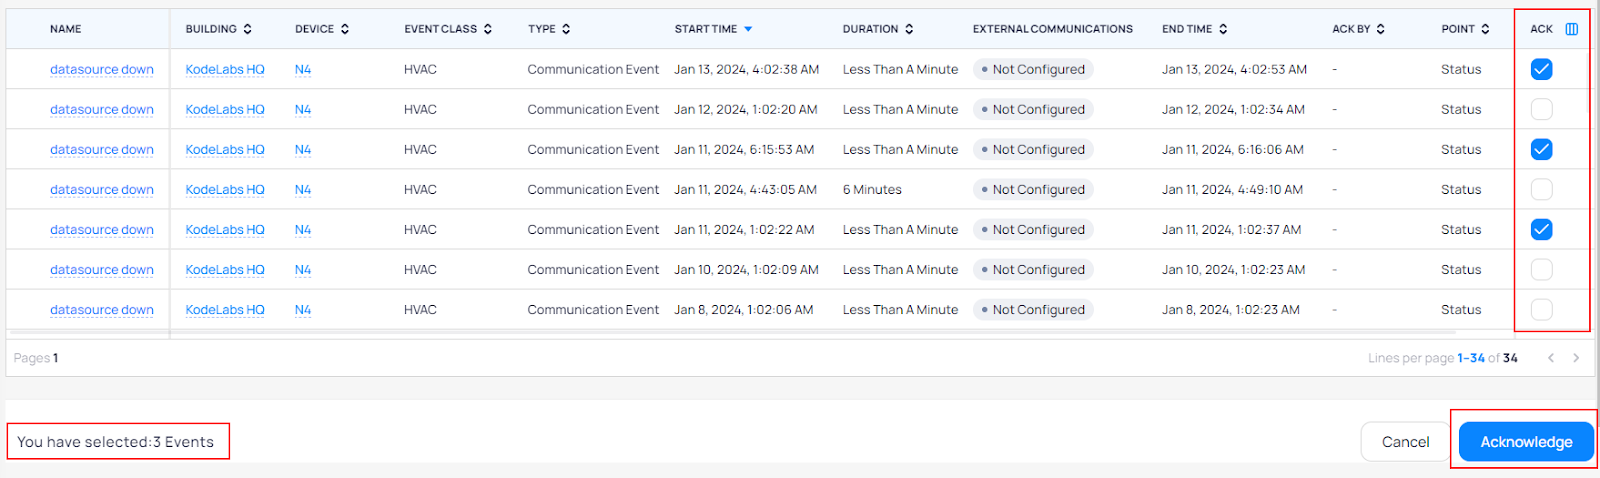
Once you hit the “Acknowledge” button, events will be listed as acknowledged events. It is important to know that this does not resolve the events itself. Event resolution is achieved automatically once the reported cause is corrected.
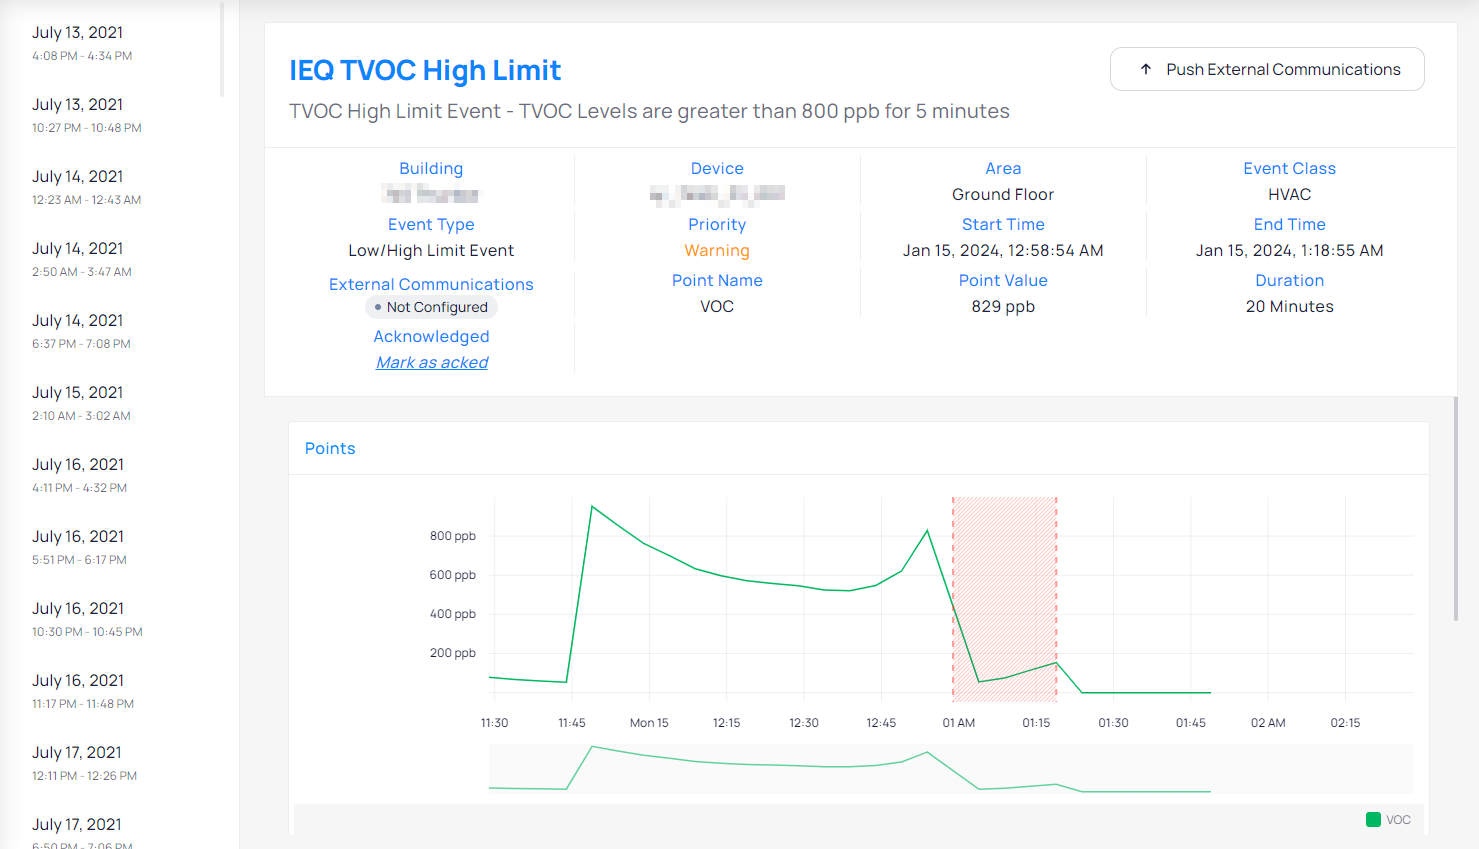
Navigating Events
Navigating through the events list is simple. Selecting an event from the event list will take you to the Event’s Details page which will provide all general information, severity and time displayed graphically, and event escalation. The screenshot below illustrates an example of event details.
Related Articles
FDD Dashboard
Fault Detection and Diagnostics (FDD) is a proactive process that identifies and analyzes system failures or faults within a building's infrastructure at their earliest stages. By detecting these faults early on, FDD enhances system performance, ...Event Streaming
The FDD Streaming View provides the classical interface for monitoring building notifications along with a number of preference settings to adjust the view to needs of the portfolio or user. Highlights Automatic Refresh Streaming comes with an option ...Event Library
KODE OS automatically monitors the operation of your equipment and will raise a user’s awareness whenever event threshold conditions are met. Out of the box, KODE OS supports an event library that can be deployed to monitor HVAC, Fire, ...Event Configuration
The goal of event configuration is to establish monitoring and alarming on any of the newly integrated pieces of equipment. Follow the below steps to configure events of your choice. 1. Navigate to the Events icon through the left navigation bar. 2. ...Navigating through Device Details
Device Details helps you to determine device performance, status, history and allows you to interact with devices in order to adjust their functioning with the aim of increasing optimum performance. There are a few ways on how you can get to device ...