Multi-Point Trending
Multi-Point Trending: Seamlessly Analyze and Compare Historical Data Across All Your Building Systems
We are excited to introduce our latest enhancement to the KODE OS platform: the Multi-Point Trending viewer. This new feature makes it easier than ever to monitor your building's HVAC systems, providing a streamlined way to trend, analyze, and correlate data across multiple points in one chart. With the Multi-Point Trending feature, you’ll have the tools to identify performance issues, optimize operations, and make data-driven decisions more effectively.
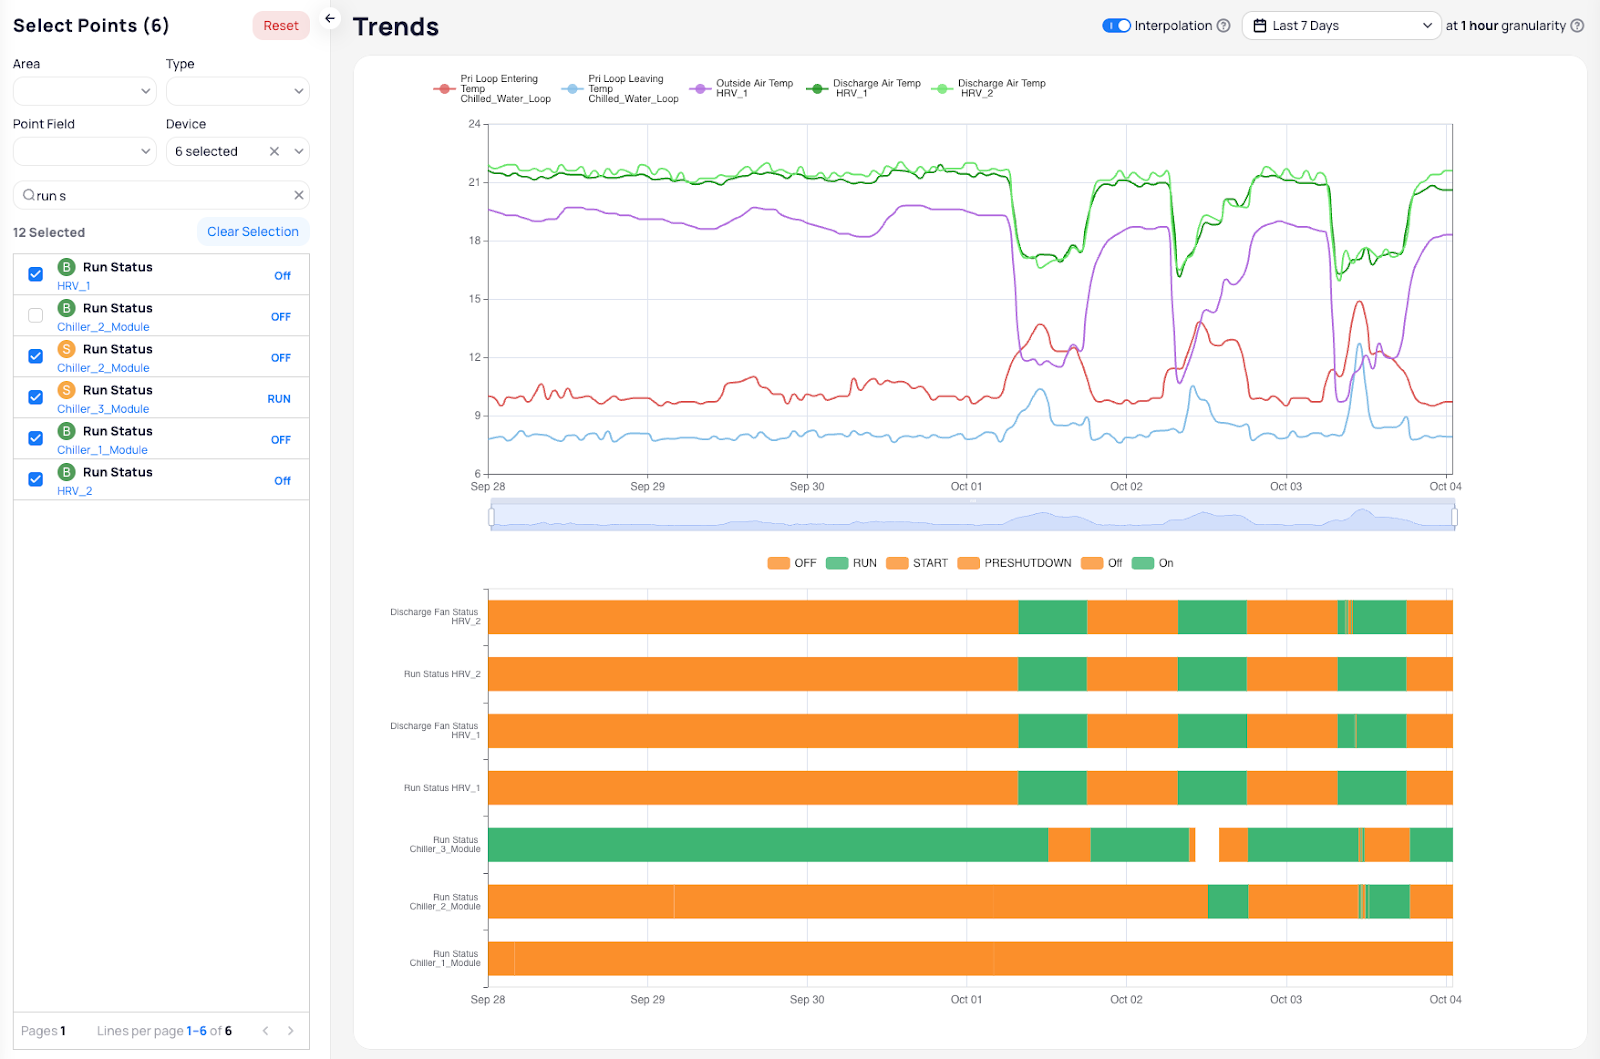
Trends Page
What’s new?
Easily Trend Any Point: Select and trend any point from any device in a single chart, with both number and status points displayed for a clear overview.
Customizable Y-Axis: Use two Y-axes to trend number points, and freely move points between the left and right axes based on your needs.
Time Filters & Zoom: Pick any time range from the top filter, and use the zoom bar or mouse/trackpad to zoom into specific time periods.
Popup for Point Values: Hover over any time on the chart to see the exact values of all trended points, making it easy to get real-time insights.
Interpolation for Smooth Trends: Missing data is automatically filled using the last known value, providing a continuous and complete trend line.
Granularity Adjustments: Data granularity adapts to your timeline automatically, from minute-by-minute for short periods to hourly or beyond for larger periods.
Aggregate Functions & Configurations: Change the aggregate function (Average, Sum, Min, Max, Delta, Count) for each point and customize how the data is visualized.
Clickable Legend: Click any point in the legend to hide or show it on the chart, keeping your visualization focused and clean.
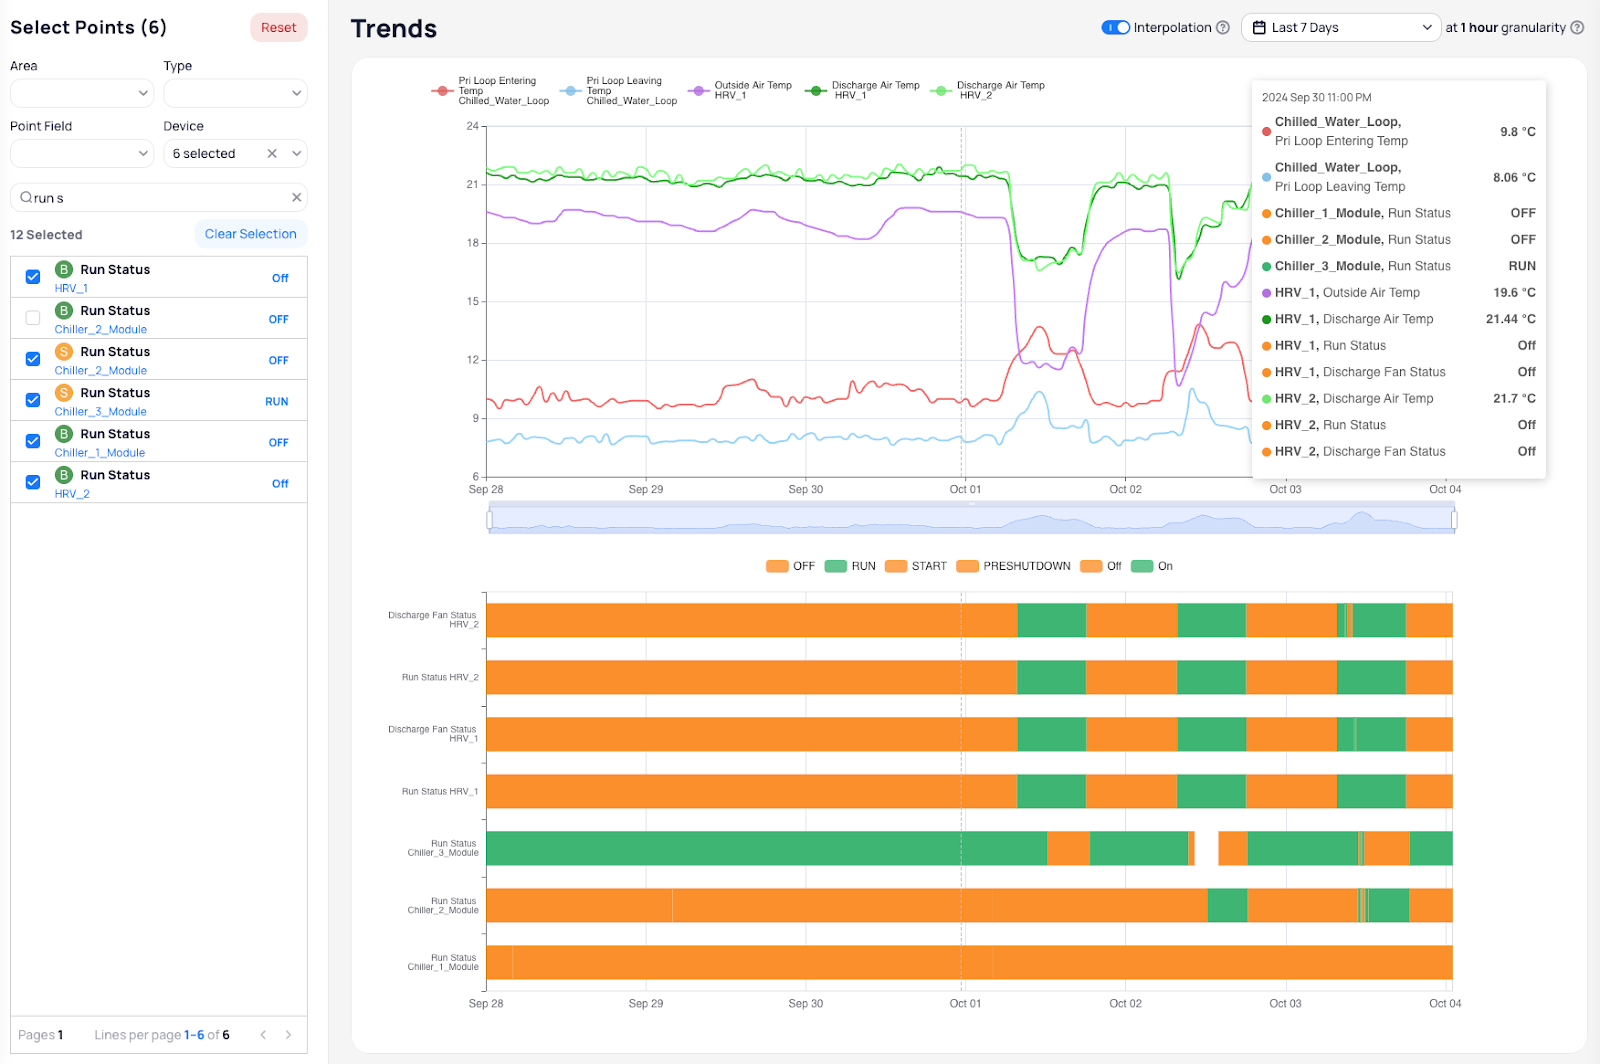
Popup when you hover over the charts
Why you’ll love it
Enhanced Monitoring: Select any combination of points and view trends in a single, intuitive chart for faster and more accurate system analysis.
Quick Troubleshooting: Identify correlations, pinpoint issues, and get detailed insights by zooming in on problem areas or hovering over time points.
Fully Customizable View: Tailor the chart to show the data that matters most to you, with flexible axes, aggregation options, and point visibility.
How to Get Started
Access the Feature: After you go into a site, the Trends module will be available on the left main panel.
Select Your Points: Use the left panel to filter or search for points by Area, Type, or Field.
View Trends: Watch the data immediately appear on the chart—line charts for number points and bar charts for boolean/enum points.
Zoom & Hover: Zoom in to explore specific periods or hover for detailed point values.
Adjust Configurations: Use the right-side panel to change aggregation settings and move points between Y-axes as needed.
Explore on your own
This update is automatically available—just open the Multi-Point Trending and start trending your points. If you’d like more guidance on how to make the most of this feature, check out our user guide.
We hope the Multi-Point Trending will significantly enhance your daily operations and make managing your building systems smoother than ever. Your feedback is always welcomed (support@kodelabs.com), and we are committed to continuously improving your KODE OS experience based on your needs.
Related Articles
Public API Authentication Upgrade - Introducing OAuth 2.0 for KODE OS
Overview We are enhancing the authentication mechanism for the KODE OS Public API by introducing OAuth 2.0. This update brings stronger security, flexible access controls, and greater visibility for integrations built on our API platform. Overview & ...KODE OS 2.0 - A redesigned KODE OS, built for amazing experiences
Dec 5, 2023 Today we’re introducing a major design update to KODE OS - going live today for your organization as a KODE Labs early adopter, and rolling out to our global installed base in general release over the coming months. With its better ...Graphics Tool Updates August
We’ve been working on a few updates to improve your experience with graphics. With enhanced point visibility, you can now easily spot critical statuses and states like ‘Down’, ‘Alarm’, and ‘Overridden’, ensuring quicker response times and better ...What's New? - Mobile App Release - Sep 3, 2021
KODE OS Mobile - 1.0.30 Sep 3, 2021 Improvements Write Point - When clicking the button to write the point it sends you directly to the write point screen compared to the old version which showed the connected points. Floor Plan Marker - Temperature ...Improved Points & Device Management: New Page Enhancements & Batch Editing
Point and Device Management Made Simple and Fast We've made key updates to the Points and Device features to simplify and enhance how these are managed in your building or portfolio. One standout improvement is the addition of a left sidebar ...