Functional Testing Tool (FTT) Dashboard
Functional Testing serves as a digital commissioning tool designed to validate the operational functionality of the equipment. KODE Labs accommodates a diverse range of tests applicable to various types of equipment, with its primary usage centered on zone controllers like Fan Coils, Variable Air Volume (VAV) systems, and Heat Pumps.
FTT Dashboard
To access the Functional Testing (FTT) Dashboard, follow these steps:
Navigate to the left side of KODE OS where all other features are listed.
Look for and select "FTT" from the list of available features.
Once you access the FTT Dashboard, you'll find that it displays a summary of conducted tests along with further details using various widgets. These widgets present comprehensive information about each test, including where and when it was completed, the building in which
To access the FTT feature on a specific site, you need to click on the “Portfolio” button on the top left corner and choose the site of your choice. Once you select the site, please click on the “FTT” feature listed on your left side where further details will be presented regarding that specific site.
In the top right corner of the FTT Dashboard, you'll notice some windows that provide data regarding completed tests. These windows offer a quick overview of important test-related information.
- Building Name (if you are in portfolio FTT dashboard),
- Area,
- Workflows,
- Device Types,
- Statuses,
- Save - use the "Save" option to save the filters for yourself or for Portfolio,
- Clear All - you can use this option to clear all filters.
Projects and
Workflows
FTT Projects
If you select “Projects” a list of tests will appear where you can see buildings where the tests have been completed, device names, workflow, description, schedule type, status, the last occurrence, the next occurrence, and the number of devices.
On your left side through the “Filters” window, you can filter the specific building and device. The list will be personalized based on your filters and will give you the needed information regarding that particular test.
You can also create a new job through the “Create Project” button on your right side, you simply follow the steps and a new job will be created with the given details.
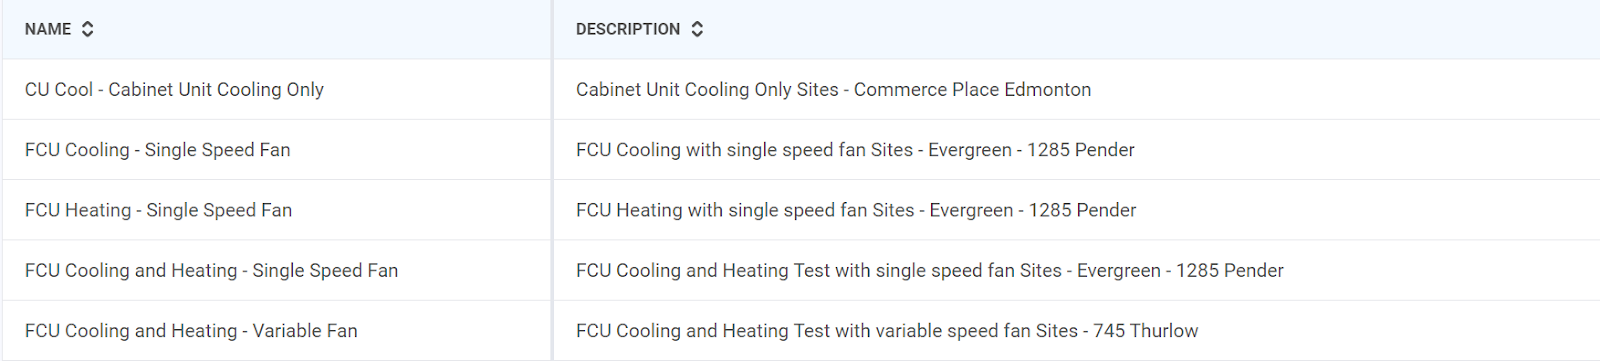
FTT Workflows
Whereas if you click on “Workflows” a table with all the workflows created will be displayed. You can also create a new workflow by clicking on the “Create Workflow” button on your right side, deciding a name, description, duration, and adding the device.
Navigate through FTT Dashboard Widgets
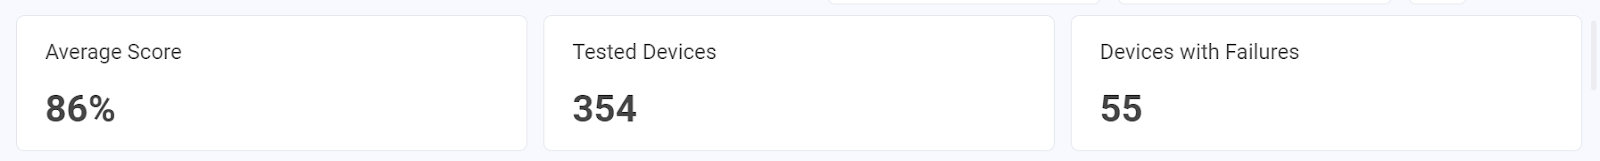
The initial widget on this page will showcase the following metrics:
Average Score: This metric represents the average performance score or rating for the conducted tests.
Tested Devices: This metric indicates the total count of devices that have undergone testing.
Devices with Failures: This metric highlights the number of devices that exhibited failures or issues during testing.
It is important to note that these metrics are dynamic and will change based on the date selected on the calendar. The widget will adjust the displayed data to reflect the performance and testing outcomes for the date chosen, allowing you to track and analyze trends and variations over time.
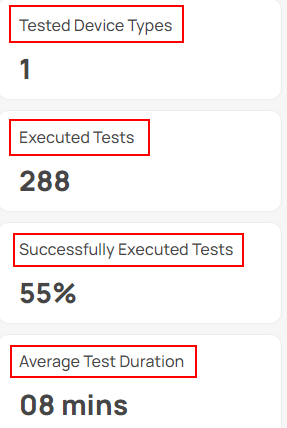
Another widget with further information on tested device types, the number of executed tests, the percentage of successfully completed tests, and the average test duration will be presented on this page, see the screenshot below:
Building Score Widget
The Building Score widget will graphically display buildings where tests have been completed and failed. By clicking on the green or red color on the shown pillars, data will be customized on other widgets as per your selection.

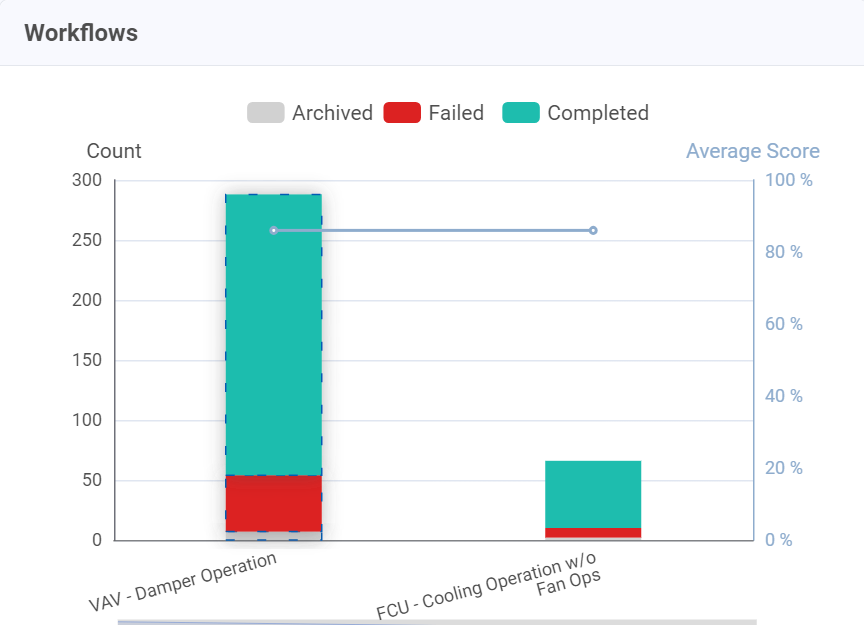
Workflows Widget
The Workflows widget offers a graphical representation of the tested devices through pillars or columns. Hovering over these pillars, further details will be presented regarding the archived, failed, and completed tests, the average score, and the total number of executed tests.
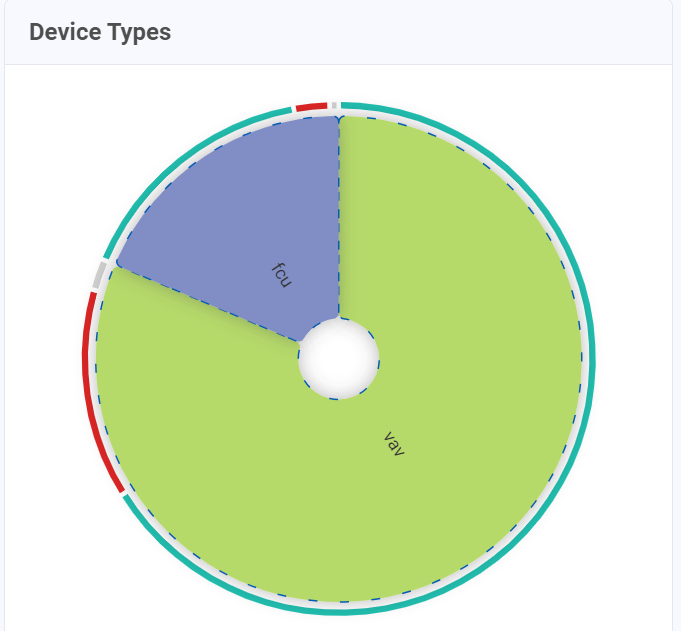
Device Types Widget
The Device Types widget utilizes a pie chart to showcase the various tested device types. A total number of tested devices will be presented if you hover over them. Furthermore, by clicking on a particular device type, all widgets will dynamically personalize their content based on the selected device.
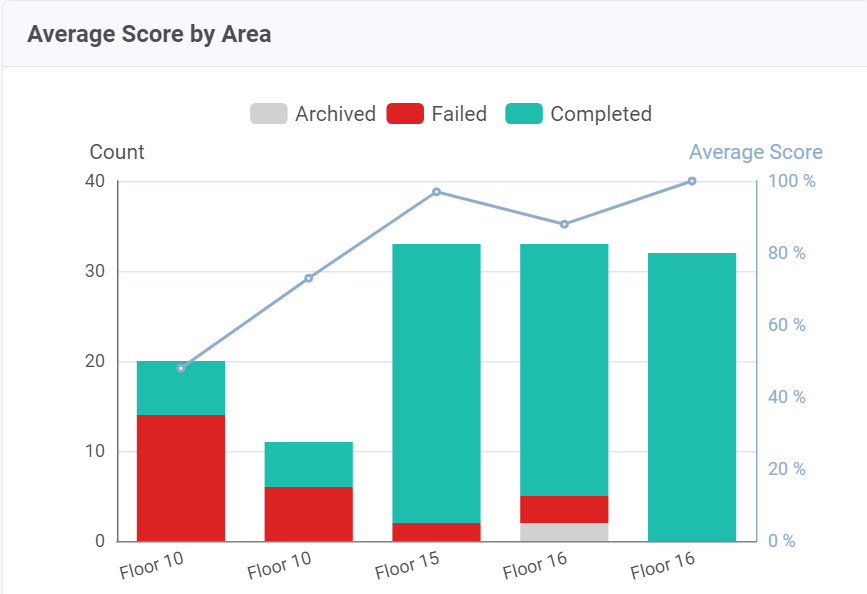
Average Score by Area Widget
The Average Score by Area widget will graphically display all failed, completed, and archived executed tests. This widget shows the specific area where the test was performed.
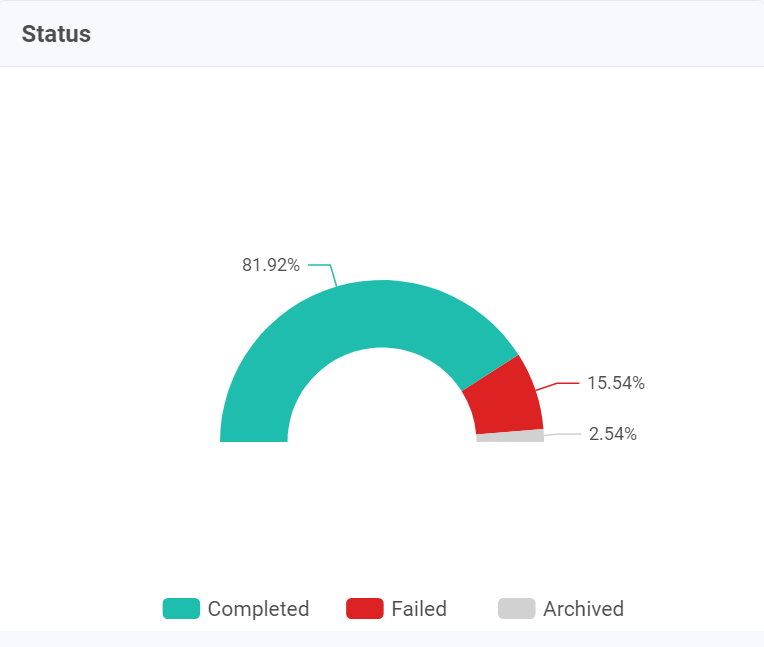
Status Widget
The Status widget provides a visual representation of the status of completed and failed tests through different colors. Hovering over the widget will reveal the exact number of completed and failed tests. If you click on one of the colors or segments, all other widgets will automatically update to provide data based on your selection. This dynamic feature allows you to focus on either the completed or failed tests and obtain related data through the other widgets, providing a more customized view of the testing results.
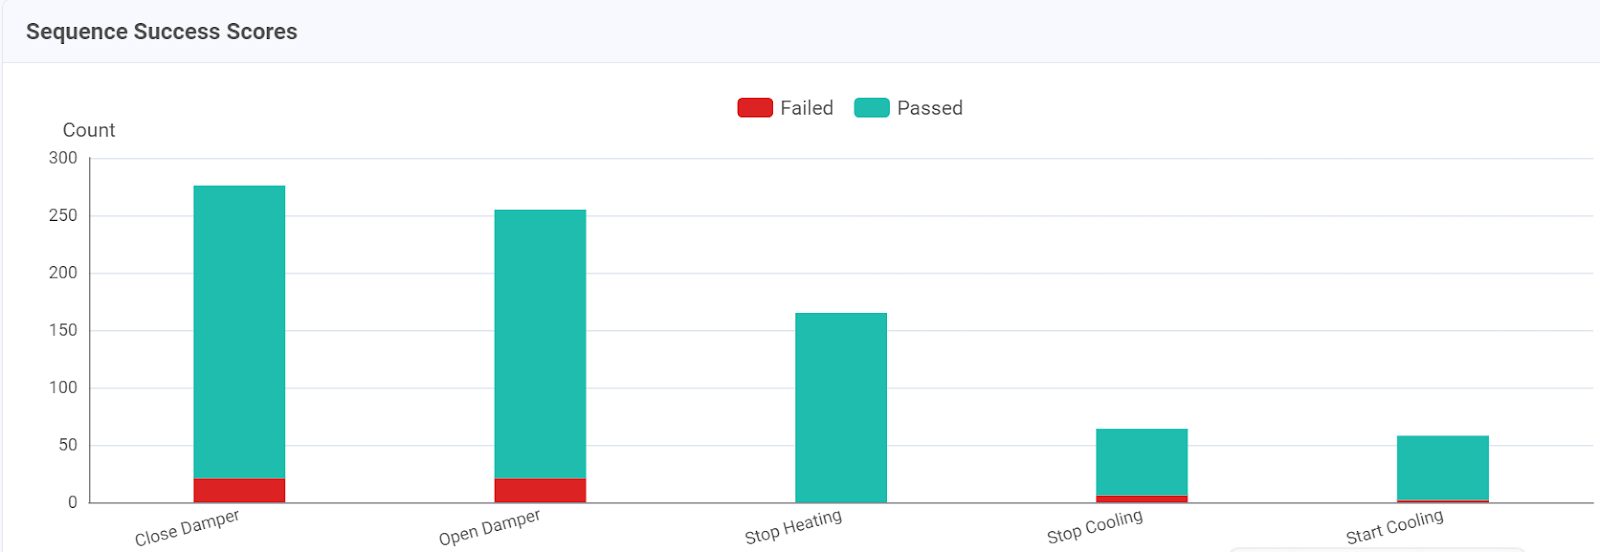
Sequence Success Scores Widget
The Sequence Success Scores widget provides a graphical representation of both passed and failed tests. These graphs allow you to visualize the outcome of tests related to specific commands such as "Close Damper", "Open Damper", "Stop Heating", "Stop Cooling", and "Start Cooling". An example is illustrated below:
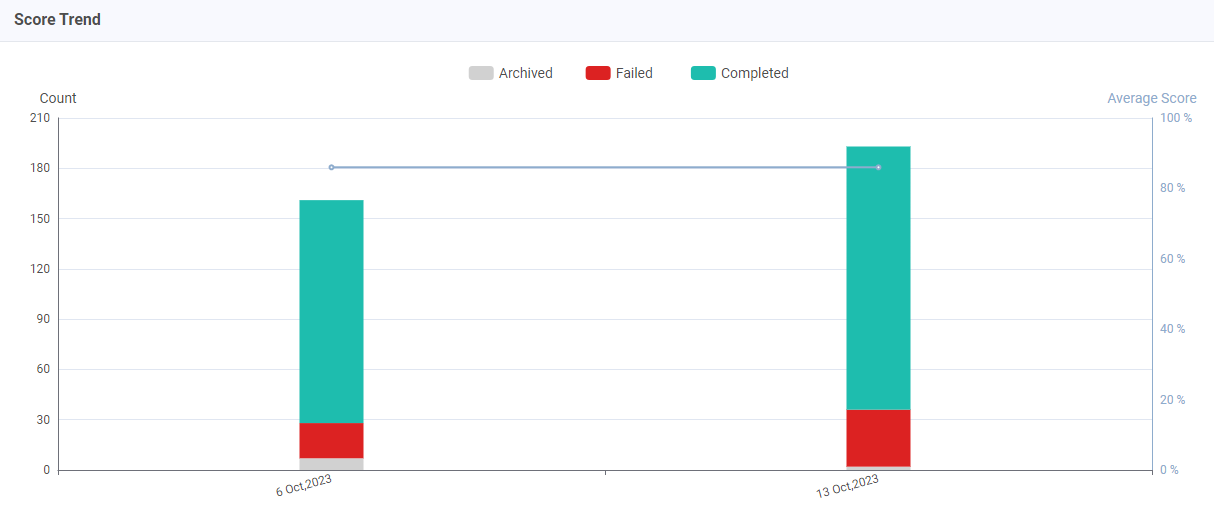
Score Trend Widget
The Score Trend widget displays the dates of scores when tests happened. If we hover over we will see the number of archived, failed, completed, and average scores of tests on that specific date. An example is illustrated below:
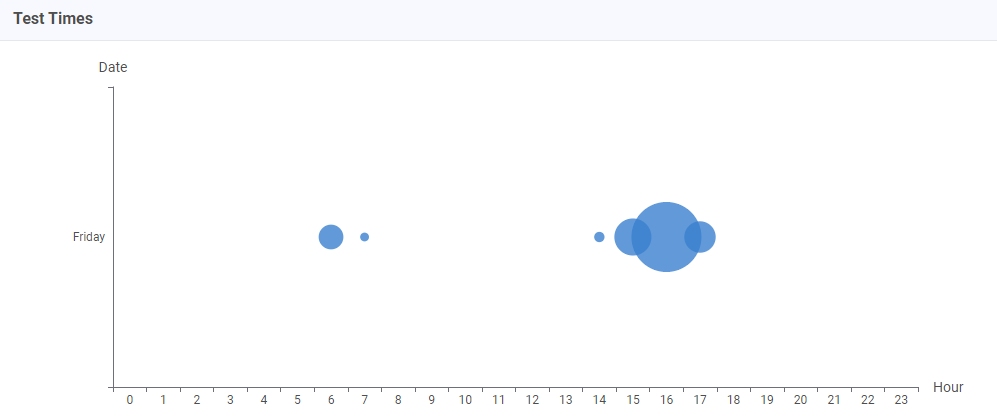
Test Times Widget
The Test Times widget will show the day when the test occurred and through some circles shown on the graph, we can see the number of tests completed each day. See the screenshot below.
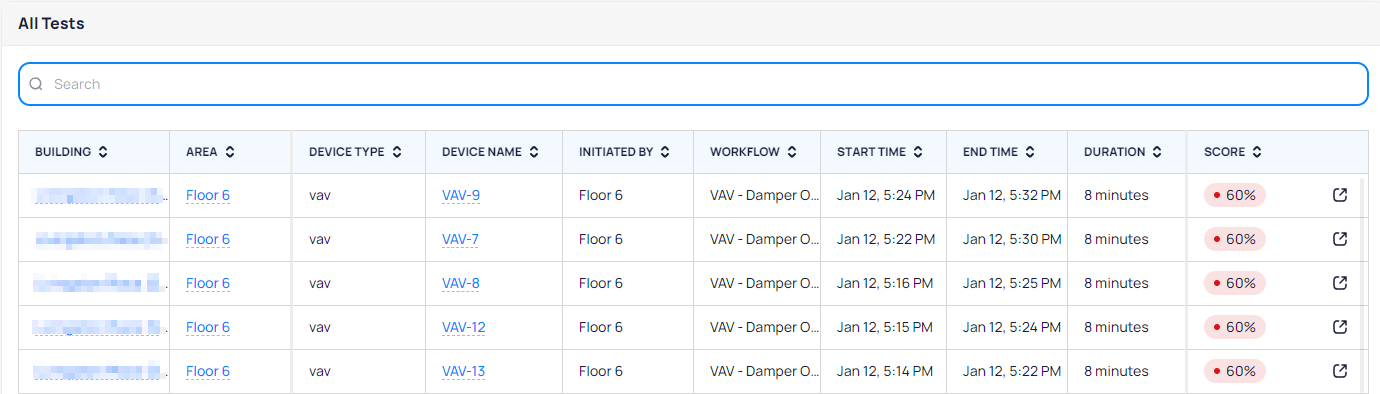
All Tests Widget
The All Tests widget, presented in tabular format, shows further details of the building, area, device type, device name, the time the test started, ended, and its score.
Clicking on any row in the table will navigate you to the specific test’s details and its complete history. Within this page, you can easily browse through other tests by clicking on the "Next" button located on the right side.
The All Tests widget allows us to search for any specific test that we would like to see further details on. Based on the date we pick in the embedded calendar, the table will be updated and show us tests on the selected dates.
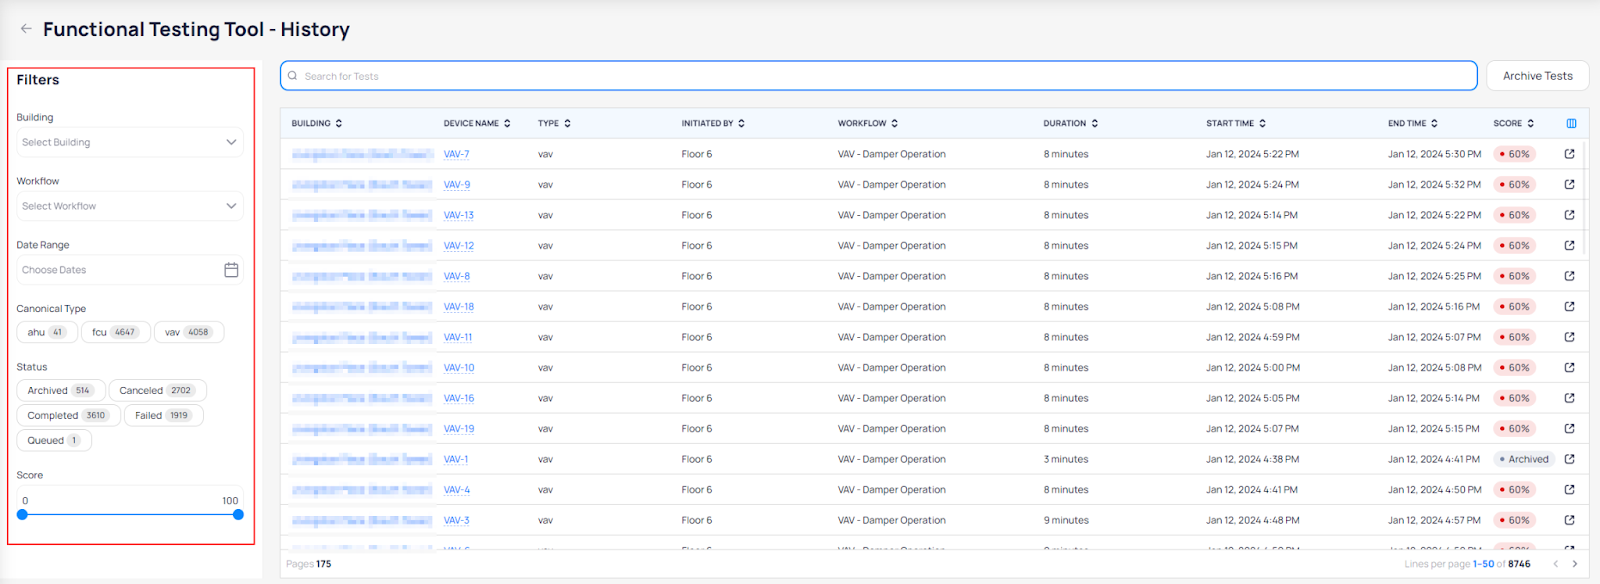
Functional Testing Tool - History
By using the "View All" button located in the top right corner, you gain access to a comprehensive list of tests, each explained in detail. This feature enables you to search for and select a specific test, and in doing so, you'll receive in-depth information about that particular test.
On the left side of the screen, you'll find filters that allow you to narrow down your search by specifying criteria such as the building and other relevant details. When you apply these filters, the table will automatically adapt and display data personalized to your selection. This customization ensures that you can efficiently focus on the tests that are most pertinent to your needs.
Related Articles
Running a Functional Test
Functional Testing is a digital commissioning tool to validate equipment operation. KODE Labs supports a variety of tests on a variety of equipment, but it is most commonly used on zone controllers such as Fan Coils, VAVs, and Heat Pumps. Running a ...FTT Projects
Hello there ? If you’re reading this then you’re well on your way to functionally testing your building. To get started, enter the main FTT page from the left sidebar on KODE OS. In the 3 dots, you will see projects. The idea is to create a ...Functional Testing Tool Creators Guide
Creators Guide Table of Contents Introduction 3 What is Functional Testing? 3 Overview 3 Workflow Example 3 Common Use Cases 4 Workflow Architecture 4 What is a workflow? 4 Components of a workflow 5 Sequence Architecture 7 Building A Workflow 10 ...What is FTT?
Understanding Functional Testing Why functional testing is important Traditionally, functional testing is a process that occurs during the commissioning phase of a building new construction or retrofit. When a building is commissioned, every piece of ...Navigating through the Site Dashboard
The Site Dashboard is the main menu for a building which is displayed after selecting a desired building from the building cards on the map view. The menu is broken down and organized into widgets which represent a feature of KODE OS filtered for the ...