Table View and Device Details Export
You usually monitor device performance, status, history, and interact with devices to increase optimum performance, but what if you could also view the device history as a table or line chart and export it as a CSV file instead? With the data exported in a table view, you can further dive into the data and share it with external parties.
Navigate to Device Details - Table View
You can get to the device details in a few ways:
Via the Site Homepage > Devices > search and select the desired Device from the device list.
When you search for a device by name and select it, you will be taken directly to its Device Details page.
The search function can be accessed by clicking on the search icon in the main navigation bar on the left.
Via the Site Dashboard > Areas > Select a Floor > from the floor plan graphic Click on Device Name (the same can also be achieved via system graphic)
To access the Table View, click on the Table Viewicon at the bottom of the right sidebar
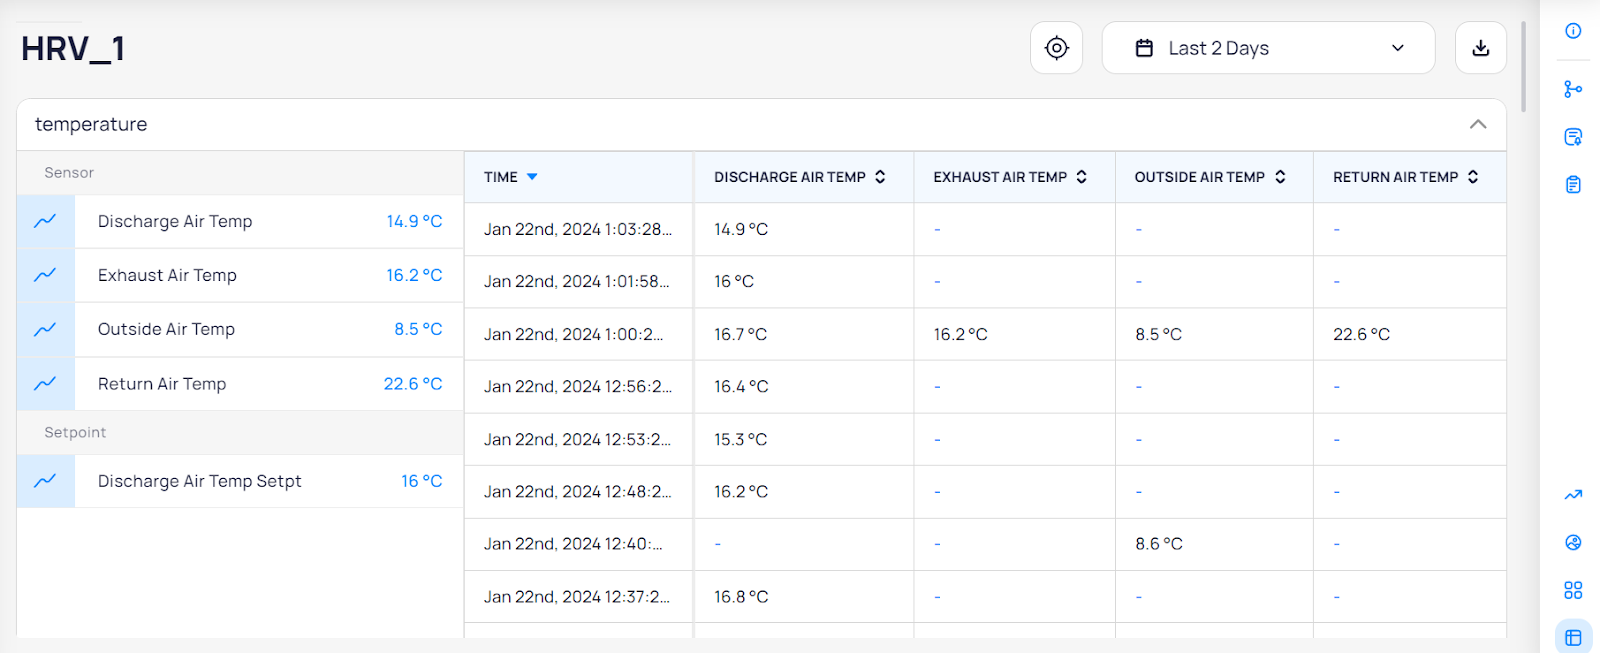

You can also customize the Table View:
To view data from a specific date, select it at the top of the device details view.
Each column represents a point and you can add/remove by toggling the chart button on/off.
Each row is a timestamp representing point values.
You can adjust the column width by dragging the boundary on the right side of the column heading.
You can sort the table by date and time (Oldest/Newest), point values (high/low) or alphabetically.
Export Device History Data
You can export data from Device Details in a CSV format. You can export the data in a few ways depending on how you plan to use it.
Click on Export button at the top of device details page (Table or Dashboard View).
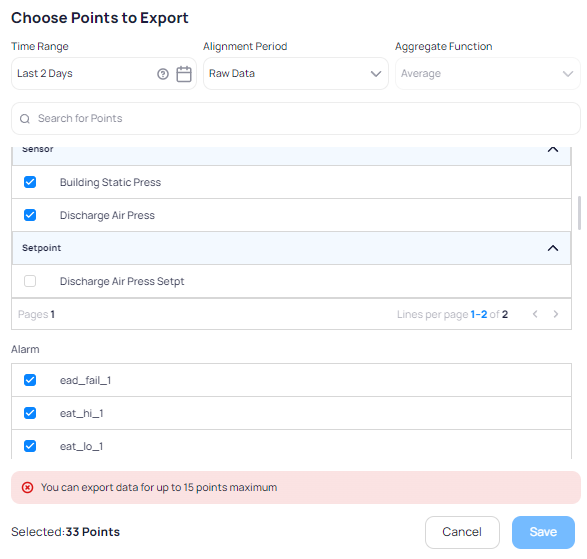
At “Choose Points to Export” page select:
The points you want to export from that device
The date range
The alignment period:
Raw Data
15 minutes
30 minutes
1 hour
Using these aggregate functions:
Average
Sum
Min
Max
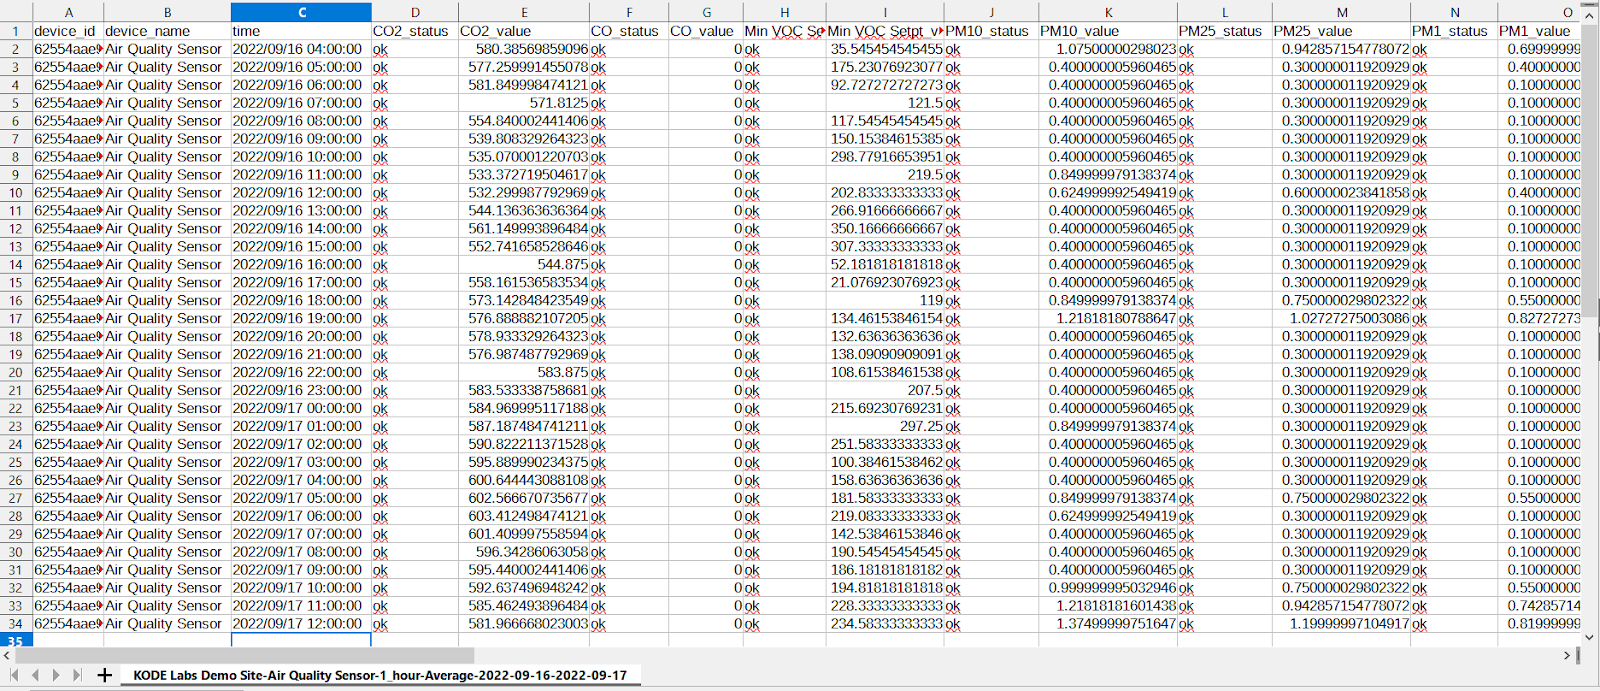
On the exported file the data has the following structure:
Device ID and Name
Time
Selected points are individual columns
One column for point Value, one for point Status
The name of the exported file has the following format:
{SiteName}-{DeviceName}-{AlignmentPeriod}-{StartDate}-{EndDate}
Start and End Date are the dates selected for the export.
Related Articles
Navigating through Device Details
Device Details helps you to determine device performance, status, history and allows you to interact with devices in order to adjust their functioning with the aim of increasing optimum performance. There are a few ways on how you can get to device ...Device Graphic
Device Graphic is a powerful tool for visualizing your building's HVAC system in real time. It allows you to monitor and control your AHU, VAV, and HVAC devices and their components, all from a single interface. Overall, Device Graphic is an ...Device Referencing
In Building Management Systems, referencing is vital for creating a digital twin, a virtual model that mirrors real-world device connections. This helps diagnose issues, run functional tests, and ensure efficient building operations. Building devices ...Adding a new Data Source
To enable the device discovery in KODE OS, it's essential to add a data source to import the necessary data. Follow the steps below for instructions on how to proceed: 1. Click on the site of your choice. 2. Navigate through the options on the left ...Schedules Calendar view
The Schedules Calendar View provides a visual representation of schedules across various timeframes, enhancing visibility and planning. This dynamic view allows users to: Visualize Schedules: Switch between daily, weekly, and monthly views to manage ...