New In-House Graphics Powered by KODE has Arrived
We’re thrilled to announce that Graphics creation as we know it has been completely transformed. There’s a graphics
builder we’ve been cooking that gives you the ability to build System and Device Graphics and customize floor plans
with additional functionality that outperforms any other graphic tool in the industry. Tailored by the feedback given
from our community of system integrators, this has been designed to deliver faster and more scalable deployments,
while also automating repetitive processes such as updating markers, creating tables, and layer configuration.
Why this New Module?
Graphics is an in-house creation space to create System & Device Graphics, and customize floor plans without
having to leave KODE OS - it wouldn't be called a single pane of glass otherwise, would it?
We’ve created Graphics for three key reasons:
In-house graphics creation: Create your graphics and edit them whenever you need to on your own terms. In-house tools, in-house rules - we have full control over the functionalities of our Graphics. This also means that your feedback is invaluable to advance this in the future.
Faster deployments: With functionalities like batch marker editing, layer configuration, and table creation, you cut down the number of clicks you need in order to make the edits. Configuring a floor plan or a system is a breeze now.
Offer more value to your users: Along with all the cool updates to make the deployment of graphics faster and scalable, Graphics introduces features that your users will love - Smart Markers, Zone Drawing, Tables. Smart markers will indicate their values by their colors - users will be able to understand if everything is performing at their peak performance in one glance. In the next few months after we transition, users will be able to drag and draw zones directly on the floor plans so they can indicate different tenant spaces. Last but not least, building operators are huge fans of tables next to their system graphics - they can easily drop all the different points they need to know about how the system is operating, is there any alarm in place, and any system key and system parameters. Again, all this is self-service.
What’s new for you?
Easy batch editing/moving/deleting - Simply batch-select the markers by dragging the mouse or clicking on them and performing batch updates compared to the old tool where you needed to edit the markers one by one. This will save a lot of time on floor plan or system configuration.
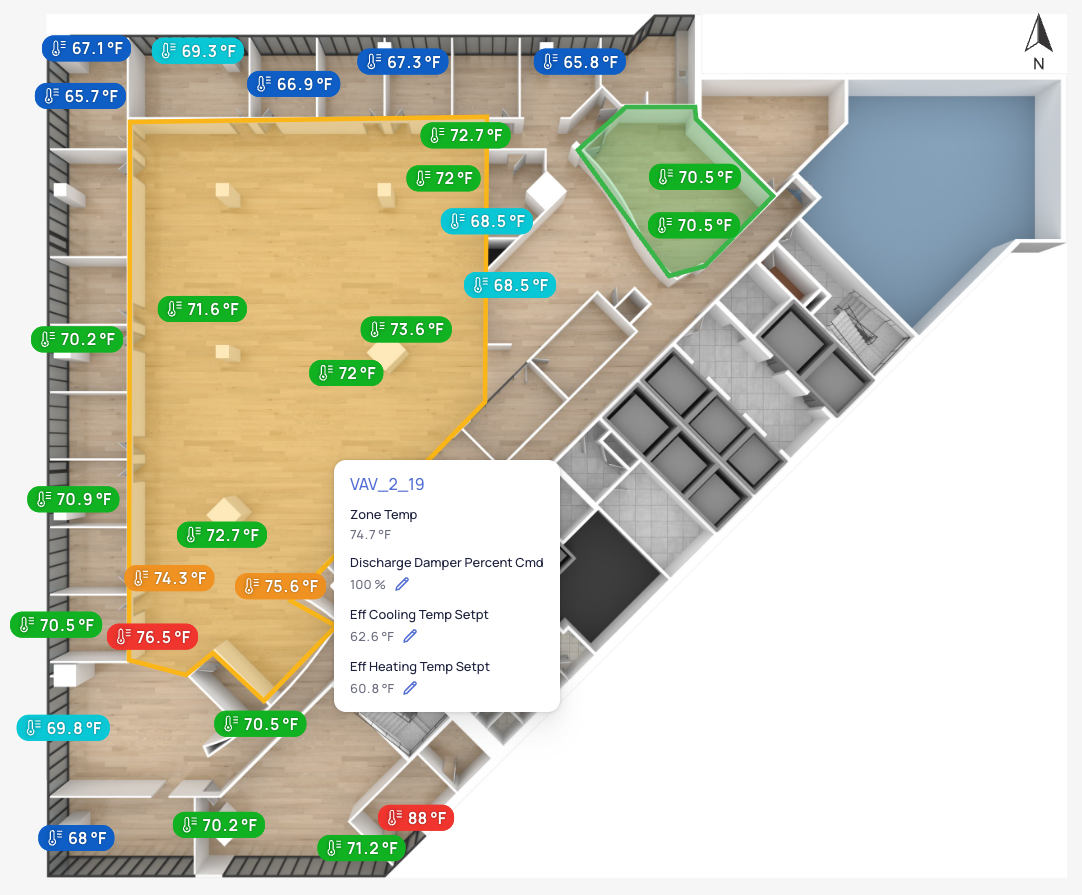
Smart markers - These new sets of markers will be color coded based on the point value, which will also be shown in the graphics.
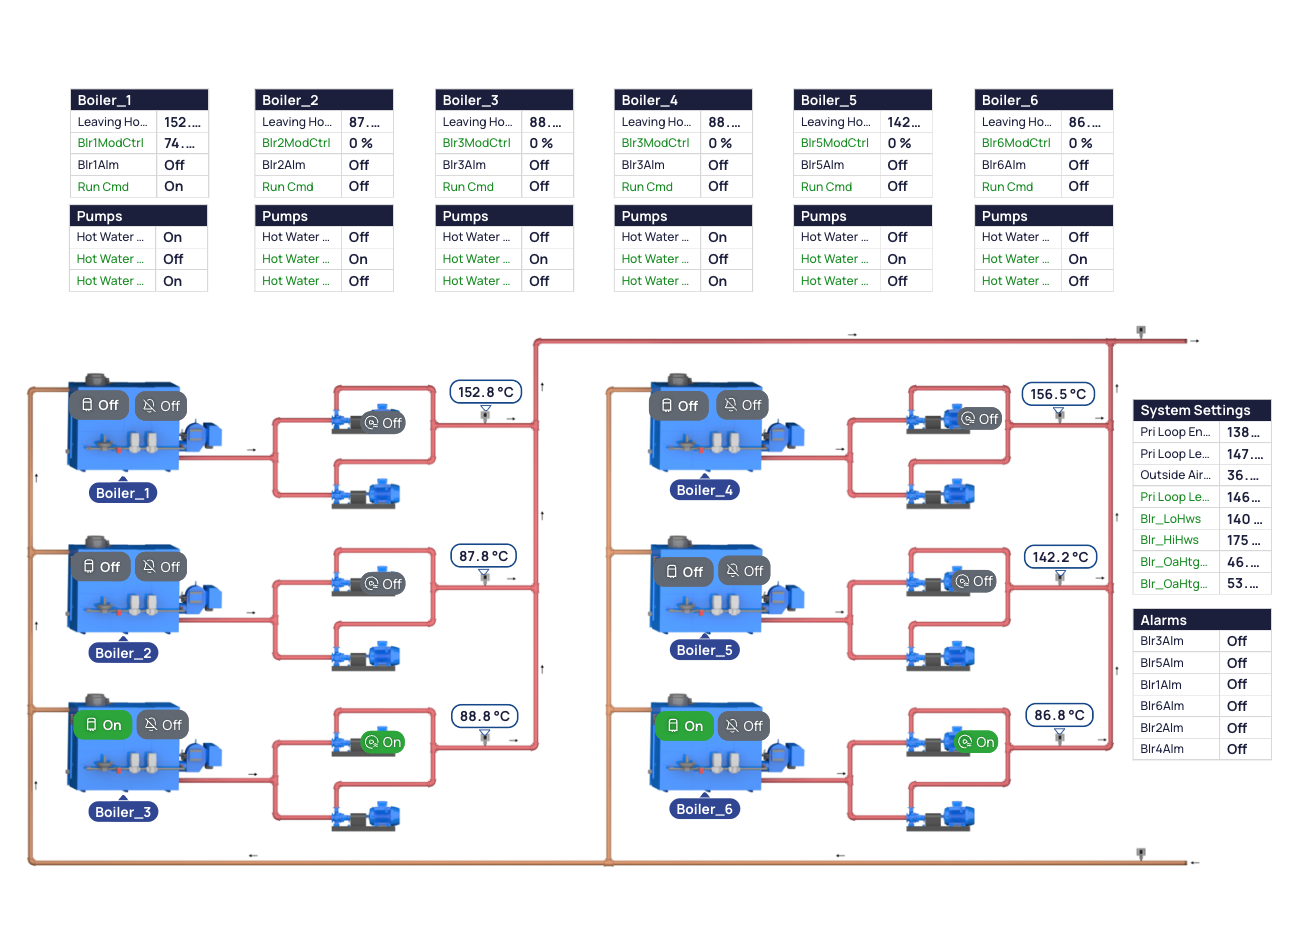
Create table - Easily create a table in a few clicks! Table views that list the points from certain devices are a new standard for our system graphics.
Zone drawings & control - You’ll be able to draw zones, choose which devices will control the zones, and how it is going to get colored. Now you won’t have to hard code them and you’ll be able to configure everything in the Graphics module.
Layers and everything else is configurable - The floorplan layer is dynamic, so you can create them and be able to set predefined configurations for each such as:
Default device type and points
Default marker style
Default smart marker configuration
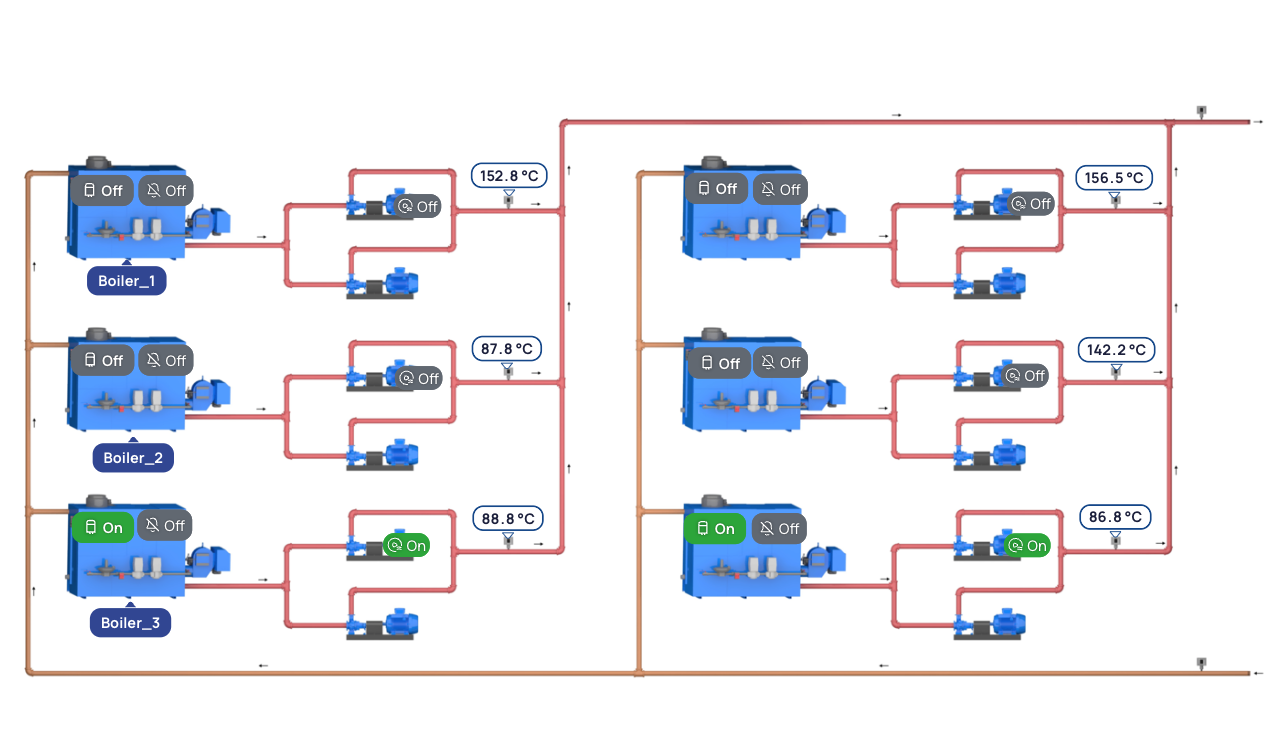
Ability to draw and adjust systems - Create system drawing in the Graphics module with easy to use drag and drop components.
Easing the Transition
To make this shift as smooth as possible, we're keeping you informed via emails and providing a wealth
of resources. Our client experience team is always ready to assist, offering expert guidance whenever you need it.
There you have it! Graphics is the ultimate solution for System Integrators looking to speed up their
smart building deployments.
With this new release, you can be confident creating graphics yourself is gonna be a gamechanger.
Give it a try and see how it can transform your graphics deployment experience!
Related Articles
Graphic Tool Release Note
Graphics (Floor-plans, System views) are essential for a modern BMS system. The new update that KODE Labs has released today will enhance the user experience by making the graphics more useful and completely customizable. This update will enable you ...Transitioning to the New KODE Graphics Tool
The graphic you are viewing was created using KODE’s old Graphics Tool. This tool will soon be retired and will no longer be supported in KODE OS. Why the Change? In 2024, we introduced a new Graphics Tool with significant improvements and features, ...Graphics Tool Updates August
We’ve been working on a few updates to improve your experience with graphics. With enhanced point visibility, you can now easily spot critical statuses and states like ‘Down’, ‘Alarm’, and ‘Overridden’, ensuring quicker response times and better ...What's New? FTT Release
KODE Labs is releasing a big update on the Functional Testing Tool! The new Functional Testing Tool allows you to use the Workflows Engine to define procedures and steps for testing any Mechanical Device and running Digital Commissioning. Depending ...FTT, KODE OS Mobile - 1.0.57
Dec 13, 2021 Functional Testing Tool KODE Labs is releasing a big update on the Functional Testing Tool! The new Functional Testing Tool allows you to use the Workflows Engine to define procedures and steps for testing any Mechanical Device and ...