Navigating through Device Details
Device Details helps you to determine device performance, status, history and allows you to interact with devices in order to adjust their functioning with the aim of increasing optimum performance.
There are a few ways on how you can get to device details:
Via the Site Menu go to your Building > Devices > Select Desired Device > Device Details (the same can also be achieved via floor plans)
Searching for a device by its name via the Search Function and selecting it will take you directly to its Device Details page
Via the Site Dashboard > Areas > Select Floor > Click on Device Name > Device Details
Using Device Details
In both ways you will reach the device details page which is divided into three main sections:
Points of the devices
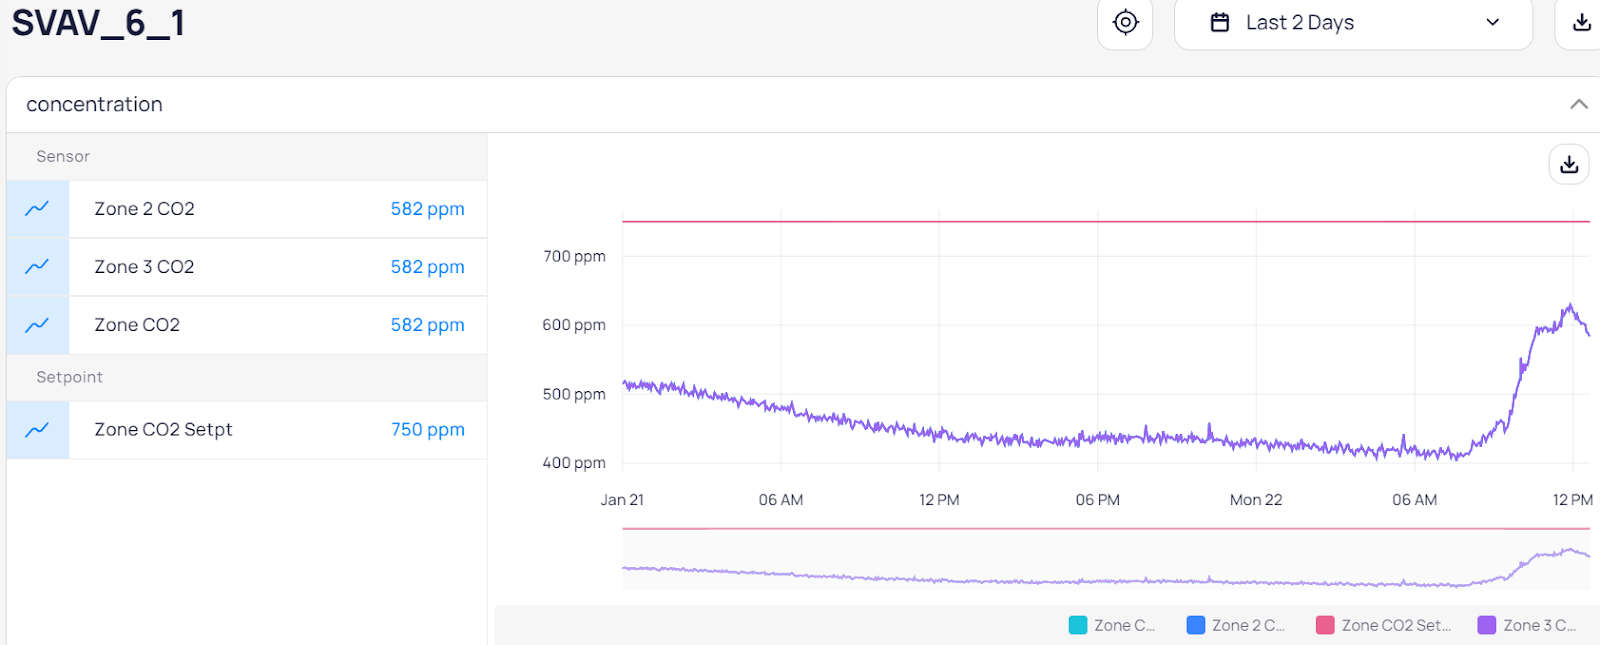
Charts - device history
Right hand sidebar

In the left section you will see all points grouped by type (e.g Concentration, Pressure, Fan) and represented visually. You can turn the visualization on or off by selecting the button on the left side of each point. Upon enabling, the visualization will show a trend of the point depending on the type of the point (i.e. graph, boolean, etc.)
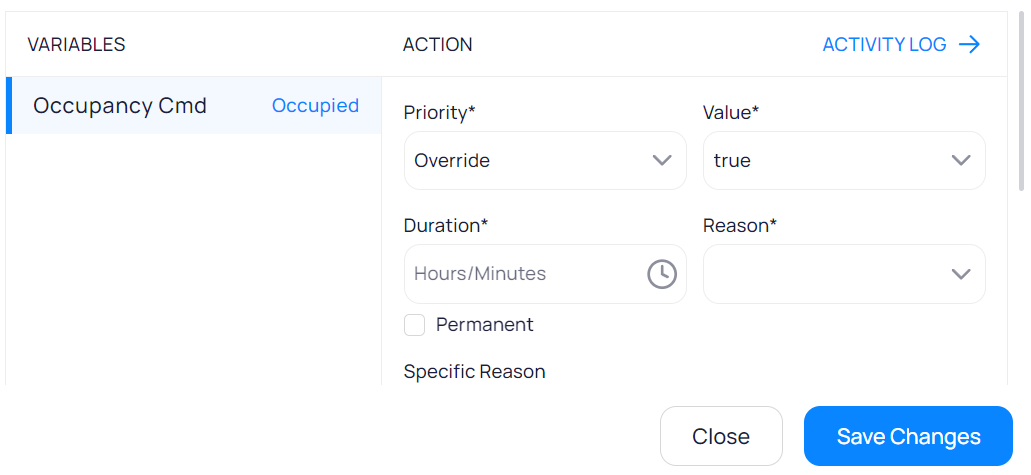
Hovering on points it will show a write icon on its right side.

Selecting it will take you to the Write Point menu where you can modify the values based on your preferences.

Device History
History will show a historical performance of the selected device. For example in the case of a HVAC device it will show the temperature history. The default time period to view the history is 2 days; however, this can be modified to longer and shorter lengths in the upper right hand corner of history.
In cases of temperature history, Outside Air Temperature can also be selected in order to show it in comparison with the temperature values provided by the device.
Hovering upon the chart will show you the name of the point, its value as well as the exact time for the given value.

Right hand sidebar
The right sidebar inside of device details has multiple options including:
Device Information: Here you can see all relevant device information including edge device, building, area, location, device name, type, tags, and reference
References: References will show the associated devices to the selected device.
Attachments: Here you can add notes and upload attachments related to the device.
Active Events: View and manage all active events related to the selected device.
Dashboard View: View Device Details categorized by point type as determined by the device itself.
Exporting Charts
Navigate to Device Details through the steps mentioned in the first part of this article.
Click on the export button on the upper right hand corner of the chart.
For exporting you can select between PDF and image views.
Note: PDFs are preferred as standalone documents whereas image views are appropriate if you need to integrate them into an existing document, presentation, etc.

Basic View
You can also switch to the dashboard view by using the button in the lower right corner In the dashboard view .

Basic View of the device details page is divided into three main sections:
Inputs, Variables, and Outputs for the selected device
History (if applicable)
Temperature History (if applicable)
Right hand sidebar
In the first three quadrants named Input, Variable, and Output, the users can interact with the device, see its actual values which are shown through sensors as well as device points status.
Inputs represent the values and feedback from physical or network connected sensors (i.e. temperature, current, status, etc.)
Variables are the options that you can change to your desired settings (i.e. setpoints).
Outputs control and display the device behavior that changes per our set variables.
Related Articles
Device Referencing
In Building Management Systems, referencing is vital for creating a digital twin, a virtual model that mirrors real-world device connections. This helps diagnose issues, run functional tests, and ensure efficient building operations. Building devices ...Table View and Device Details Export
You usually monitor device performance, status, history, and interact with devices to increase optimum performance, but what if you could also view the device history as a table or line chart and export it as a CSV file instead? With the data ...Device Graphic
Device Graphic is a powerful tool for visualizing your building's HVAC system in real time. It allows you to monitor and control your AHU, VAV, and HVAC devices and their components, all from a single interface. Overall, Device Graphic is an ...Device Templating
Templating aims to make naming historical data consistently easy throughout your building or portfolio, and there are a few ways to set up templating. To template a single device, navigate to the "Devices" section on the right-side dashboard. Locate ...Device Linking KODE OS - myMSI
To link devices that you have discovered in KODE OS and added in myMSI as well, go to KODE OS > Device Details. Click on the three dots at the bottom right hand corner of the devices list > from the drop down menu select Linked Devices. You will be ...