Navigating Dashboards
The Insights page surfaces information from the many base building and IOT systems installed in buildings into easy to read and useful visualizations.
To access insights, use the Dashboard button on the left-hand navigation bar. Insights are used to create and show dashboards on a portfolio level.
The experience of adding and customizing Insights is the same as in the Site Dashboard, however, what makes a difference is the ability to configure these widgets for multiple buildings.
To create a multiple-building widget, follow the below steps:
- Navigate to the Site Dashboard and click on the 3 dots button on the top right corner.
- Select Add Widget from the drop-down menu that appears.
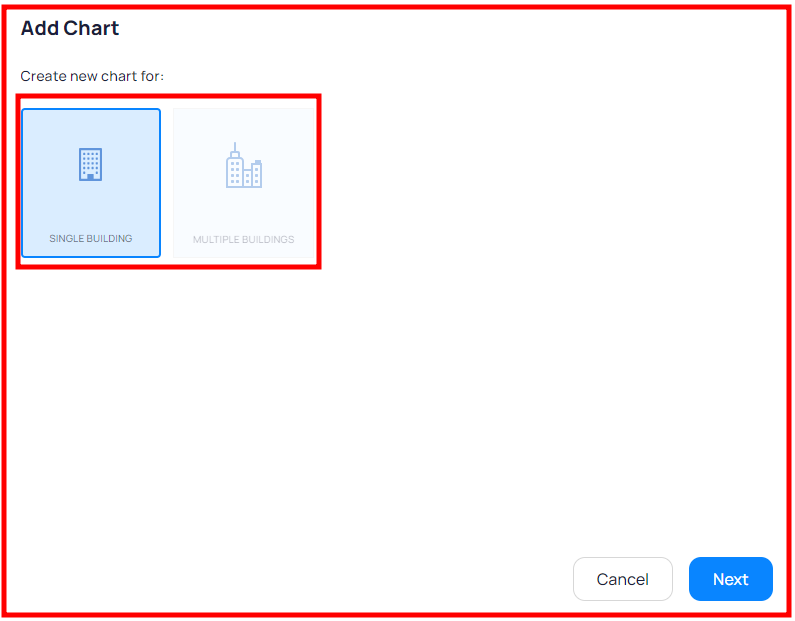
- Click on a Widget of your choice, and you will be shown two options
- Single Building
- Multiple Buildings
Once you've selected the option of your choice, the steps you take are the same as described in our Customizing Site Dashboard Widgets article.
Related Articles
Building BI
Building BI tool is a feature within our platform that allows you to view data on a dashboard and chart form. This data can provide valuable insights into the performance of your building management solution, helping you make informed decisions about ...Navigating and Customizing Portfolio Dashboards
The second highlighted feature of the KODE OS platform is Dashboards. This functionality empowers users to personalize portfolio dashboards based on specific requirements and the type of data you wish to display. To manage this page, the main button ...Navigating to Floor Plan Insights
To gain a comprehensive visual overview of device placement across different floors and areas, along with the ability to interact directly with these devices, Floor Plans serve as an invaluable tool. Each area is equipped with its own dedicated ...Device Connectivity Report
The Device Connectivity Report provides a comprehensive overview of data sources and the uptime and downtime status of devices at a portfolio level. This report enables you to filter information based on individual buildings, areas, and data sources. ...Navigating through the Site Dashboard
The Site Dashboard is the main menu for a building which is displayed after selecting a desired building from the building cards on the map view. The menu is broken down and organized into widgets which represent a feature of KODE OS filtered for the ...