Navigating and Customizing Portfolio Dashboards
The second highlighted feature of the KODE OS platform is Dashboards. This functionality empowers users to personalize portfolio dashboards based on specific requirements and the type of data you wish to display.
To manage this page, the main button to complete operations is located on the top right corner, which is the three buttons.
Through this button, we may:
Add Dashboards
Arrange Dashboards
Add Widgets
Arrange Widgets
Delete Dashboard
Clicking on the "Add Dashboards" button triggers a window to appear, prompting users to input the Dashboard Title, Description and specify the User Access Level, determining who has permission to view the data on the newly created dashboard.
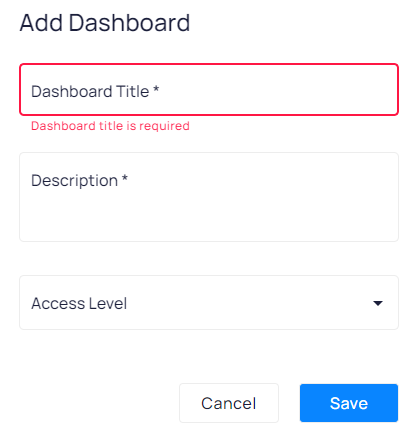
After selecting the desired data and clicking the "Save" button, the newly created dashboard will be promptly added to the dashboard list. Within this dashboard, users can tailor widgets to their specific requirements.
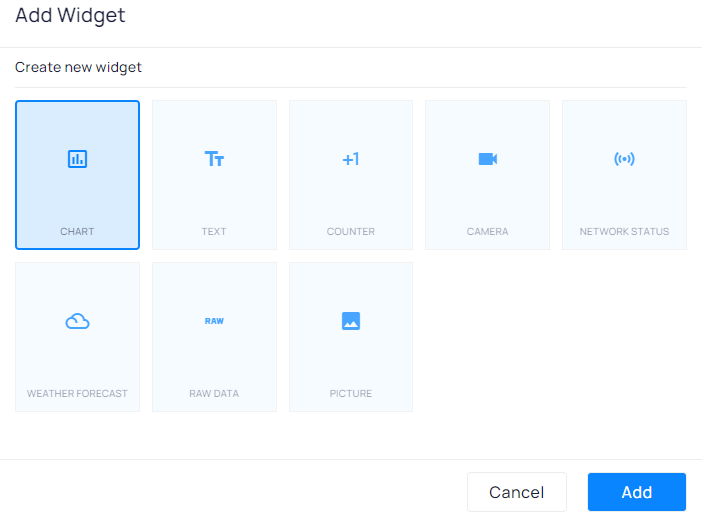
To create widgets, navigate through the three-button icon and choose "Add Widgets." Subsequently, select the preferred widget type from options such as Chart, Text, Counter, Camera, Network Status, Weather Forecast, Raw Data, or Picture. Upon selecting the desired widget, click the "Add" button to incorporate it into the dashboard.
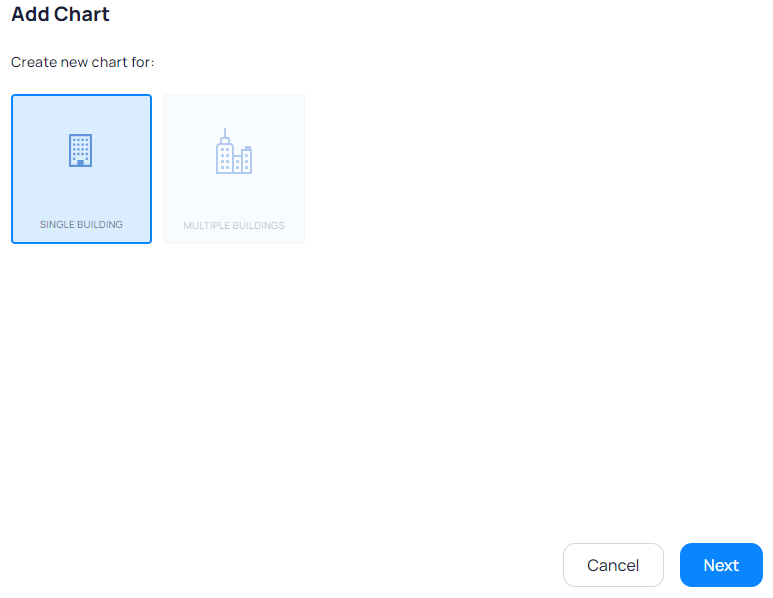
Here you may choose the single or multiple buildings. It depends on the data you would like to present then click on the “Next” button.
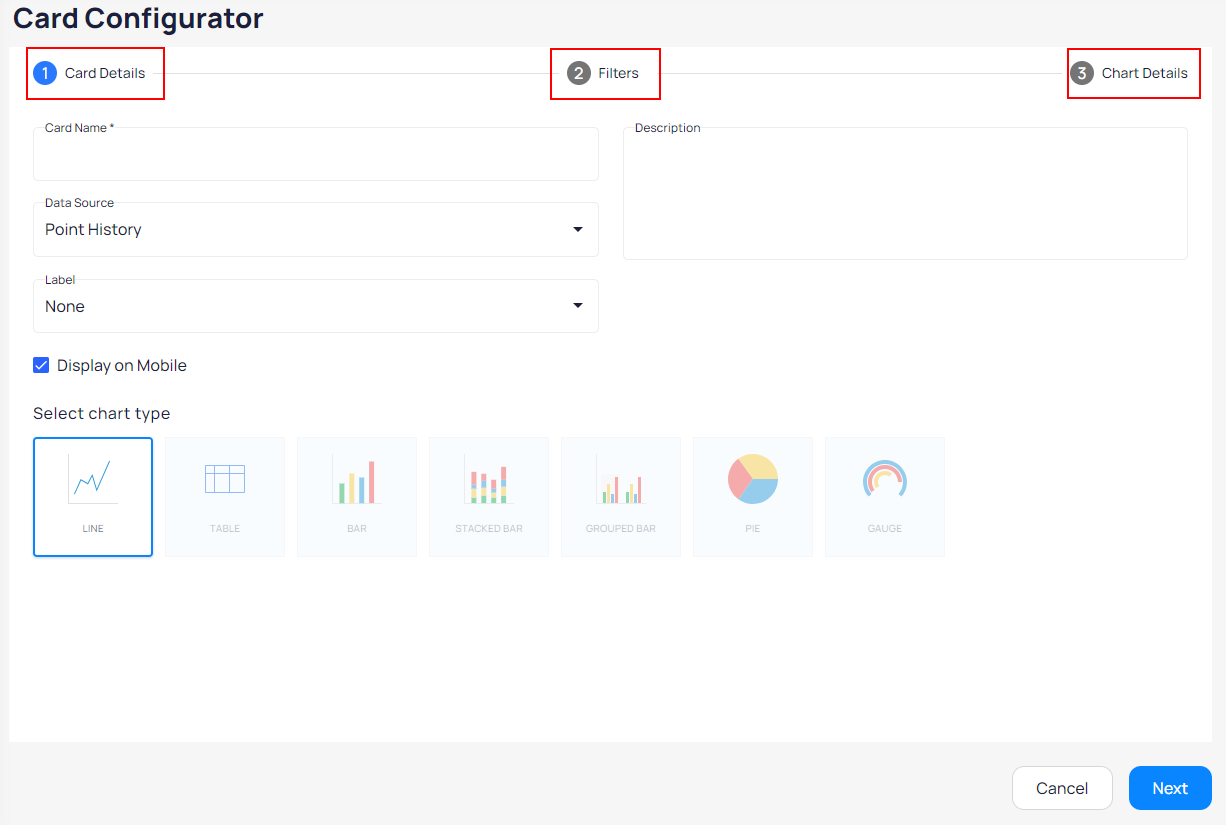
At this stage, the Card Configurator page will open up which has three sections to be filled out to create the widget.
You need to complete the Card Details, Filter, and Chart Details with the details we want to be shown in the widget, once you click on the “Save” button, the widget will be shown within the created dashboard.
To customize the arrangement of dashboards according to your preferences, click on the three buttons at the top right corner and select "Arrange Dashboards." A window displaying all created dashboards will appear, allowing you to effortlessly rearrange them through the drag-and-drop method. Once satisfied with the arrangement, click the "Save" button to apply the changes.
Furthermore, under the three-dot menu, you'll find the crucial "Arrange Widgets" button. This feature empowers users to organize widgets through a simple drag-and-drop method, ensuring they align with specific preferences and requirements.
In instances where a dashboard is no longer needed, the "Delete Dashboard" option, located within the three dots at the top right corner, offers a convenient solution. Simply select the dashboard you wish to remove and click on "Delete Dashboard" to complete the deletion process.
Related Articles
Navigating Dashboards
The Insights page surfaces information from the many base building and IOT systems installed in buildings into easy to read and useful visualizations. To access insights, use the Dashboard button on the left-hand navigation bar. Insights are used to ...Navigating through the Site Dashboard
The Site Dashboard is the main menu for a building which is displayed after selecting a desired building from the building cards on the map view. The menu is broken down and organized into widgets which represent a feature of KODE OS filtered for the ...Customizing Dashboard Widgets
The Dashboards can be customized to your liking, and allows you to add a number of different widgets based on what you want to have the quickest access to, from a single view. Below you will find instructions on how to add and modify some of the most ...FDD Dashboard
Fault Detection and Diagnostics (FDD) is a proactive process that identifies and analyzes system failures or faults within a building's infrastructure at their earliest stages. By detecting these faults early on, FDD enhances system performance, ...Using the Energy Dashboard
Depending on your user privileges as well as company subscription, you may be given access to an additional module called Energy Dashboard which shows data for energy consumption (inclusive of power, water, steam, gas, etc.) at the building level as ...