Integration Log
The Integration Log report is a snapshot of the deployment status on a building basis which gives you an easy to follow user-experience providing all configuration/integration features in one place and showing what is done and remains to unlock the full functionality of KODE OS.
Navigate to Integration Log
To access the new feature of the Integration Log go to KODE OS > click on the Deployment icon from the left main navigation bar.
Integration Log consists of two main parts:
Portfolio Score - the average score calculated based on the average of the configuration features/the widgets inside the Overall Report

Overall Report - shows the overall data of what we have and where we stand in the integration part

As you are working and integrating new buildings, please make sure to refresh the report by clicking on the Reload button in order to get the latest data. The report won’t refresh automatically!

Hovering over or clicking on elements of this report will give you access to more detailed information by directly navigating to the filtered page of what you select.
Each of the widget data is visualized on 2 types of charts: Bar Chart and Pie Chart.
Overall Report
Overall Report is the average score of the Progress Report. In this report you will see 5 main configuration features:
Data Sources
Devices
Points
Areas
Systems
This report is divided in two sections:
Progress Report - is a total aggregation of the subitems/configuration features. Each widget shows what is done (green bar) and what remains (red bar).
Statistics - aggregated data of configuration features, expressed in numbers.
Data Sources
At the Data Source tab on the Progress Overview section you will see the “Device Discovery” widget showing if the data sources are discovered.


You can click on the Take action button or on the chart to go directly to the Data Sources page and make further changes.
On the Statistics section you will see 3 widgets:
Number of Devices by Data Source
Number of Points by Data Source
Total number of Data Sources grouped by Type

Each of the widget data is visualized on 2 types of charts: Bar Chart and Pie Chart.
Devices
At the Devices tab on the Progress Overview section you will see different widgets showing data associated with the device details. E.g. In the Devices progress report one of the widgets we can see is “Area Assignment” - the number of devices that have Area Assignment.

On the Statistics section you will see 3 widgets:
Total number of Devices grouped by Type
Total number of Virtual Devices grouped by Type
Total number of Devices grouped by Area

Points
At the Points tab on the Progress Overview section you will see the “Templating” widget showing the number of templated and non-templated points.

On the Statistics section you will see 2 widgets:
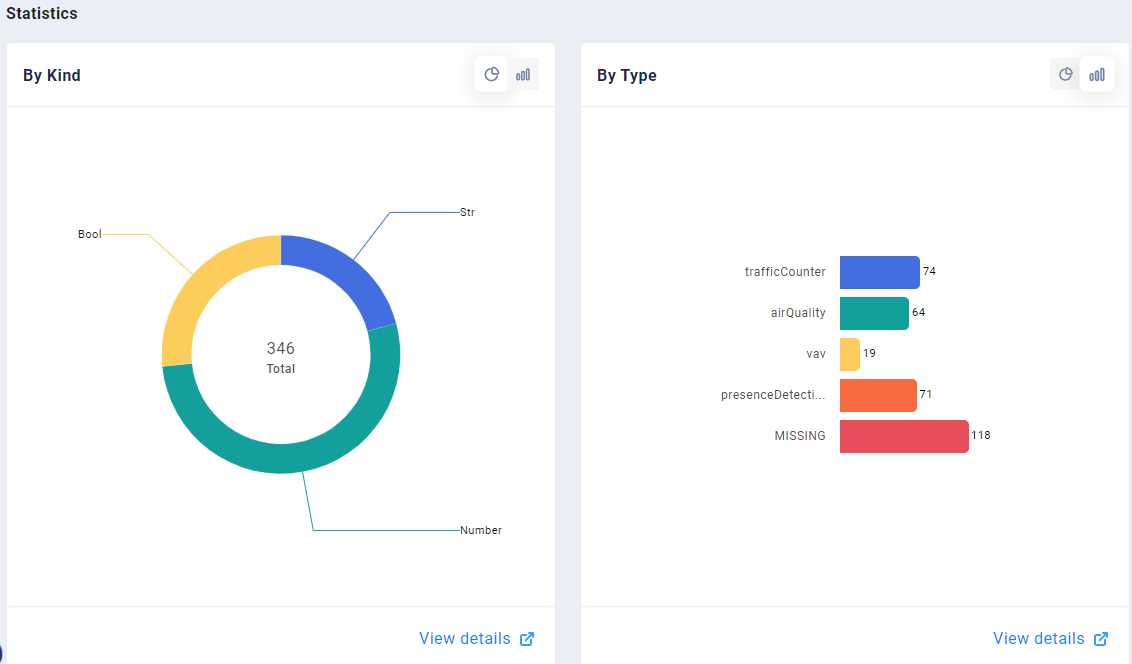
Total Number of Points grouped by Kind
Total Number of Points grouped by Type
Areas
At the Area tab on the Progress Overview section you will see the “Device Placement” widget showing the number of devices that are placed into floor plans and the “Floor Plan Upload” widget showing how many areas have graphics uploaded.

On the Statistics section you will see the ”By Devices” widget.
Total Number of Devices
Grouped by Area

Systems
At the Systems tab on the Progress Overview section you will see the “Device Placement” widget showing the number of devices that are placed into systems and the “Graphic Upload” widget showing how many systems have graphics uploaded.

On the Statistics section you will see the ”Systems” widget.
Total Number of Systems
Grouped by System Type

Related Articles
Deployment Audit
As your building is integrated into KODE OS, the feature in our platform “Deployment Audit” will offer insights into the integration process by defining which systems and devices have been successfully integrated and which are in the process. The ...Audit Feature
Audit Module The Audit Module allows users to view actual and historical data of related devices and points in a straightforward manner. To create an audit template including the device type and points of your choice please follow the below steps. ...Device Connectivity Report
The Device Connectivity Report provides a comprehensive overview of data sources and the uptime and downtime status of devices at a portfolio level. This report enables you to filter information based on individual buildings, areas, and data sources. ...Incident Report
1-3: Overview Visualizations 1. Status & Areas widgets Incidents are visually represented using these two widgets, enabling us to gain a graphical understanding of where the event or events occurred. Additionally, they display the average event ...Using Ontology for Uplift and Configuration
KODE Ontology represents a new way of defining devices based on operations and functionality. It is structured after and inspired by Google Ontology as an effort to create a uniform schema and toolset for representing structured information about ...