FDD User Manual
Understanding Fault Detection & Diagnostics
What is a Fault?
A fault is a period of time in which a specified condition is true on a specific device.
For example, this is a fault:
@8:00am AHU-1 Could not maintain discharge temperature within setpoint for 5 hours.
To break this fault down to illustrate the definition…
There are a number of terms used within the industry to identify this concept, and their uses are not always consistent between parties so it is important to understand when these terms are used within the KODE Labs platform, what they mean in that context.
🚨 Alarms
Alarms are the lowest and simplest level of condition checking. It is usually a check programmed within the BMS or available off of the device and use only one or two points of data to detect the condition. These are most commonly an error or failure condition detected within the device and outputted as such, or a check for exceeding prescribed limits, such as a temperature out of range. They are calculated and communicated instantaneously and do not have a need to exist outside the bounds of that evaluation.
What they are good at
Alarms are great at providing a way to identify, and immediately notify necessary parties of, critical events.
What they are not good at
As alarms are not meant to have meaning outside of the block of time in which they are triggered they are not the best inputs to extract holistic and actionable big-picture insights.
Examples of Alarms
Zone Temperature Exceeds Maximum
Discharge Fan has Failed (error from device)
Freeze Status is in Alarm
Fire Alarm is Active
🌋 Events
Examples of Events
Heating Not Active when Heating Required
Discharge Air Flow Lower than Expected
Simultaneous Heating and Cooling
🛠️ Incidents
Incidents are the highest level of condition checking within the KODE Labs FDD platform. Incidents are created by finding commonalities between groups of events through a number of different criteria.
Reference Based Grouping. For this grouping type, the program looks for events along ontology relationships.
For example, if it is detected that a VAV is not able to meet its room temperature setpoint, the incident engine will look to see if there is a problem on the AHU associated with that VAV and also look for issues amongst that VAV’s siblings. If any additional events have occurred along those relationships, they are all grouped together under a single incident.
The benefit of this feature is that it performs some of that root-cause analysis that nobody has time to do — ultimately reducing the number of identified conditions down to a manageable number that guides the user to understanding the real problem.
What they are good at
Bottom line: Incidents minimize time needed for troubleshooting and investigation, and maximize the effectiveness of maintenance operations.
What they are not good at
As Incidents are designed to make lives easier, the truth of the matter is no engine like this can catch 100% of all issues. There is still a need for engineers to sort through events and derive their own insights using their experience and knowledge. For this type of analysis, you are better served by Events.
⚠️ Faults
Faults are designed to capture long-term or recurring issues that may not require immediate attention but can have a significant cumulative impact on building performance and energy use. Faults allow users to monitor, triage, and analyze patterns over time, providing insight into persistent problems that might otherwise go unnoticed.
What they are good at
Faults are useful for identifying recurring issues across devices or routines, monitoring trends over time, and helping to prioritize maintenance actions. They provide visibility into problems that could affect efficiency or reliability, even if they don’t require immediate intervention.
What they are not good at
While faults are excellent for spotting long-term patterns, they are not designed for instant alerts or root-cause analysis. Individual events or incidents may still need to be reviewed to understand the underlying causes. Faults give the broader picture but cannot fully replace real-time troubleshooting.
Events Landing Page
Navigate to the FDD Events page by following these steps:
Access KODE OS and select a site.
From the main left side bar select FDD.
Select the “List” window where you can see all Events.
Page Structure
This page offers four key data views: Active, Historical, Stream, and All. These windows give you a comprehensive way to monitor live data, examine historical trends, track real-time activity, and view all data in one place.
Filters
Click on the “Filters” button to activate filter options.
Export: Clicking this button will enable you to export the filtered table as either .csv or .pdf format. Within that dialogue, you are also able to choose the columns in the table you wish to export.
Search
Entering text into the search box will look for matches within the following fields
Event ID
Name (Routine)
Event Table
Sortable columns: Columns with up-and-down arrows next to the column name are sortable. The icon updates to indicate if the column is being sorted ascending or descending.
Customizable column visibility & order: Clicking on the icon in the upper right of the table enables the user to hide and reorder columns.
Pagination: At the bottom of the table, see information regarding the size of the table and page. Change the setting for “Lines per page” by clicking the blue number range, next to that text on the right.
View the Event report: Click on a row to see the full details regarding that incident.
Event Report
Selecting an Event from the list will redirect you to the event report page.
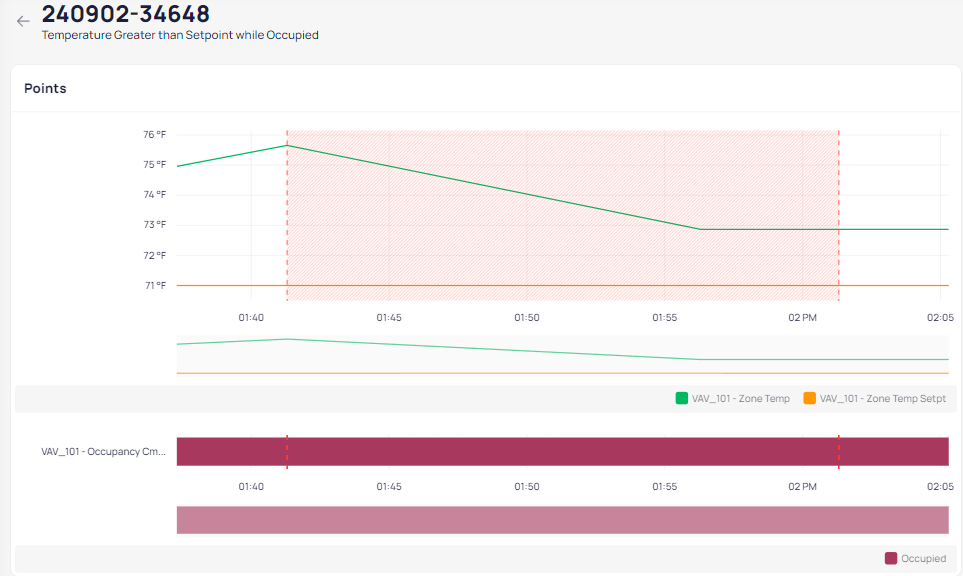
Device Trends
This section shows only the points that are referenced when evaluating the device for the stated condition. The red-shaded area indicates the duration of the event.
Event Routine
Block Diagram Sequence: This is the programming sequence that was utilized in discovering this incident. In KODE OS, this is referred to as a “Routine” and is selected for evaluation based on the device type.
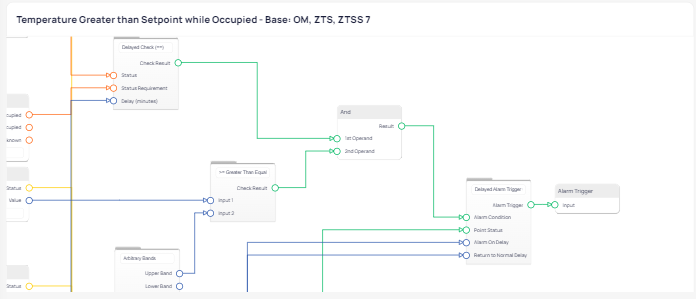
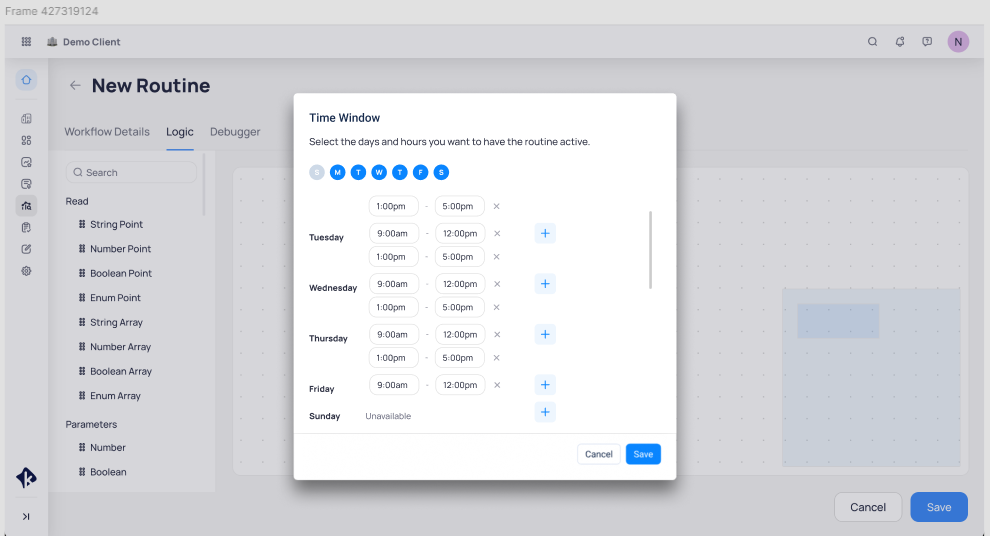
Time Window Logic Block: A logic block that outputs true/false values based on predefined days and times. This allows users to trigger events exclusively during specified hours or dynamically adjust thresholds depending on the time of day. It’s particularly useful for automating actions or refining controls based on time-sensitive conditions.
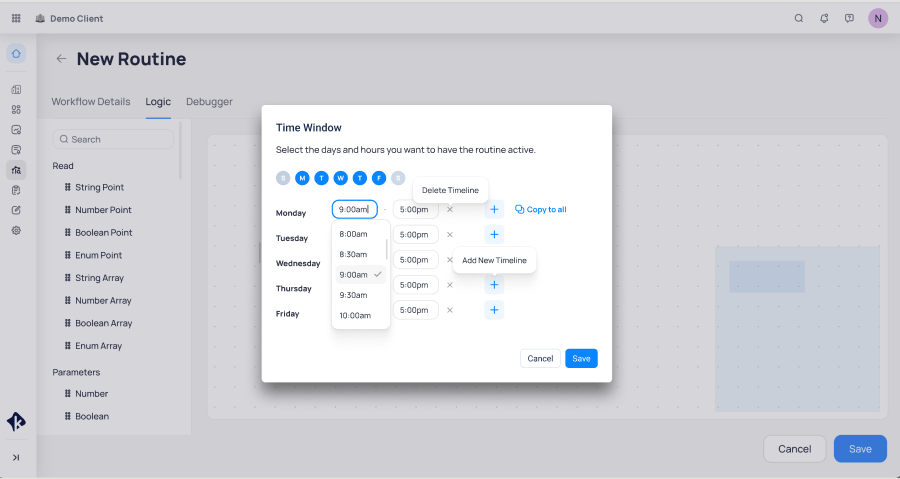
At this page you have the option to select week days and hours when you want to have the routine active.
Customizable Priority Levels
Administrators now have the ability to configure between 3 to 5 customizable priority levels, each with unique names and colors. This enhancement offers greater flexibility in managing fault events, allowing for more tailored responses and improved prioritization based on specific operational needs.
After navigating to Settings in the FDD module, you'll see five categories in the Priorities list: Life Safety, Critical, Warning, Alert, and Info. These categories can be edited and customized to better suit your needs.
You can also add a new color according to your preferences.

To access the new Event Details view, use the Switch to New Version button in the top-right corner.
Details
When an Event is selected, you will access an overview of the alert along with tools to investigate and take action.
At the top of the panel, users can:
View and manage assignees
Acknowledge the event

Sidebar
The sidebar includes the following sections:
Details: Shows general information such as the description, state, priority, point information, start time, duration, related work orders or incidents, and the affected device, area, and building.
Possible solutions (when applicable): Displays recommended actions or guidance to help resolve the alert.
Parameters: Lists relevant configuration values, with the option to open the associated FDD configuration directly.
Historical alerts: Displays past alerts related to the same device for comparison and trend analysis.
Work orders: Shows any work orders linked to the event.
Referenced devices: Allows comparison with other related devices.
Comments: Enables collaboration and documentation through user comments.
Activity log: Tracks all actions and updates related to the alert.
Incidents Landing Page
Navigate to the FDD Incidents page by following these steps:
Access KODE OS and select a site.
From the main left side bar select FDD.
Select the “List” tab at the top of the page and then select Incidents.
On this page, the default view is to see all of the created incidents for the selected site.
Page Structure
This page is divided into three main components.
Filters
Click on the “Filters” button to activate filter options.
Export: Clicking this button will enable you to export the filtered table as either .csv or .pdf format. Within that dialogue, you are also able to choose the columns in the table you wish to export.
Search
Entering text into the search box will look for matches within the following fields:
Incident ID
Building
Routines
For example, entering “Damper” will list all incidents that have a component routine that uses the word “Damper”.
Incident Table
Sortable columns: Columns with up-and-down arrows next to the column name are sortable. The icon updates to indicate if column is being sorted ascending or descending.
Customizable column visibility & order: Clicking on the icon in the upper right of the table enables the user to hide and reorder columns.
Incident summary reveal: On the right side of each row, there is an expand icon that when clicked, will reveal high-level details related to that incident.
Pagination: At the bottom of the table, see information regarding the size of the table and page. Change the setting for “Lines per page” by clicking the blue number range, next to that text on the right.
View incident report: Click on a row to see the full details regarding that incident.
Incident Report
Selecting an Incident from the list will redirect you to the event report page.
Overview Visualizations
Status & Areas widgets
Incidents are visually represented using these two widgets, enabling us to gain a graphical understanding of where the event or events occurred.
Additionally, they display the average event duration. For more comprehensive event information, please refer to the Table View.
Domains & Device Types widgets
The Domain widget displays the domain in which the issue or failure has occurred. By hovering over the chart, you can view the specific number of failures within that particular domain. Meanwhile, the Device Types widget indicates the number of devices impacted by the incident. You can gain insight into the quantity of these
affected devices by hovering over this widget.
Overall Impact
This is a timeline view of the same data provided in the Status & Areas widgets.
In this visualization, the number of devices affected are represented by the color value; the darker the color, the greater the number of devices affected.
This enables the user to identify insights and patterns along the time dimension.
Events Analysis
Table View
This is the list of all Events that contributed to this Incident. Here you can do some preliminary analysis by sorting columns and looking for commonalities.
Click on a row to open up that Event Report.
Click on the device to go to its Device Details page.
Select Points Button
If you want to be able to look at point trends across multiple devices, click on this button to open up a dialogue that will enable you to choose any combination of points across all devices impacted by this incident.
Once points are selected and applied, a new component will appear below the table containing that information.
Incident Details & Triage
Assignees
The individuals to whom this incident has been assigned are listed here.
Details
This window provides information about the incident, including the building where it occurred, its priority level, start and end dates, its current status, duration, and acknowledgment status.
Activity Log
The logged activity of changes regarding this incident.
Comments
In this section, you can enter any thoughts or comments related to this incident. Utilize these comments to communicate your findings or specify the next steps you would like the assigned person to take in order to resolve the issue.
Faults Landing Page
Navigate to the FDD Faults page by following these steps:
Access KODE OS and select a site.
From the main left side bar select FDD.
Select the “List” window where you can see the list of all faults.
Page Structure
The FDD platform offers several views to help you monitor events based on their status and your specific needs.
List: Provides a comprehensive list of all faults.
Device: View that groups all faults by device.
Routine: View that groups faults by the specific rule or routine that triggered them.
List view
The List view displays each fault in a row with details such as:
Device: Specific device name associated with the fault (VAV_410, AHU_1, etc.).
Routine: Rule or parameter that triggered the fault (Occupied - True, Insufficient Heating Operation, etc.).
Status: Current status of the fault; Open, In Progress, Resolved, Deferred, In Review, or Suppressed.
Total Events Count: Total number of times the fault has occurred.
Total Duration: Total cumulative time the fault has been active.
Time in Fault per Day: A visual representation of the daily duration of the fault.
Watchers: The users who are assigned to receive notifications for this fault.
Labels: Displays any of the labels added to the fault ( Reopened, Overdue, Work Order).
Last Comment: The most recent comment on a fault, either a direct comment or the comment captured during a status change.
Last Activity: How long ago the most recent action (comment, status change, or watcher added) took place regarding the fault (2 hours ago, 1 week ago, etc.).
Area: Physical location of the device.
Work Order URL: Shows a link icon when a fault has an open work order. Clicking the link opens the work order in your CMMS.
Use the Export button at the top-right of the table to export the table data in a CSV file.
The Faults list page displays high-level summaries of faults and their statuses.
Date picker
To view data for a specific period, select the date picker in the upper-right corner of the dashboard. You can view up to 30 days of data at one time. All metrics and displayed events are computed based on your selected time period.
Filters
To refine your view of events,
Click the Filters button, located in the upper-right corner of the page. This opens a set of dropdown slicers. The number on the Filters button indicates how many filters are currently in use.
Use the dropdowns to choose specific filters to apply to the dashboard: Areas, Device Types, Routines, Domains, Status, Labels, or Watchers. Click Clear All to remove all of the filters.
Tip: To focus on top priorities, combine filters. For example, show only Open faults for a specific routine to prioritize a specific type of issue.
Search
The search functionality allows you to quickly locate specific faults within the displayed data.
Search Box: Enter text into the search box located above the fault table. The system searches for matches within the Device Name and Routine Name fields.
Device view
The Device view shows all faults for each device over a specified time range.
Under Faults, select Device to view faults grouped by device.
This page provides a table where each row represents a device and aggregates key metrics for all faults associated with that device. The columns in this view include:
Device: Specific name of the device (e.g., VAV_410, AHU_1).
Total Faults Count: Total number of unique faults that have occurred on that device.
Total Duration: Combined duration of all faults on that device.
Time in Fault per Day: Visual breakdown of how long the device has been in a fault state each day.
Area: Physical location of the device.
Work Order URL: Shows a link icon when a fault has an open work order. Clicking the link opens the work order in your CMMS.
Click a device to view details of the triggered faults.
Routine view
The Routine view shows how a routine’s rules are triggering faults across different devices.
Under Faults, select Routine to view faults grouped by routine.
Each row in the table represents a specific routine and displays aggregated data for all faults generated by that rule. The columns in this view include:
Routine: Name of the routine that generated the faults.
Total Faults Count: Total number of faults generated by this routine.
Total Duration: Cumulative time all faults from this routine have been active.
Time in Fault per Day: Visual breakdown of the daily duration for all faults associated with this routine.
Area: Physical location where the faults occurred.
Work Order URL: Shows a link icon when a fault has an open work order. Clicking the link opens the work order in your CMMS.
Click a routine to view the details of the faults triggered for the routine.
Fault Report
To view more information about a fault,
Click its row in the List view. The Fault Details page opens.
This page shows the following information about the fault:
Points Trend View: Below the summary section, you’ll find the Points Trend panel. This view allows you to visualize and analyze the points related to the fault over time.
Trend all points associated with the fault to understand their behavior during the fault period.
Switch between visualization types (Bars, Lines, or Combined) to view the data from different perspectives.
Select additional points like Device Status or Data Source Status to monitor their connectivity behavior and detect issues over time.
The red-shaded zone in the chart highlights the exact time range when the fault occurred.
Table View: Below the trend graph, a table displays the same fault events in a structured format. Each row includes the Event Name, Duration, Start Time, and End Time of the fault.
When a Fault is selected, the right-hand panel focuses on fault-specific context and tracking.
The sidebar includes the following sections:
Details: Summarizes fault occurrences, duration, general fault information, and associated device context.
Comments: Allows users to add notes and collaborate on the fault.
Work orders: Displays any work orders linked to the fault.
Referenced devices: Provides visibility into related devices for comparison or investigation.
Related Articles
Event Streaming
The FDD Streaming View provides the classical interface for monitoring building notifications along with a number of preference settings to adjust the view to the needs of the portfolio or user. Highlights Automatic Refresh Streaming comes with an ...Handling FDD Config Updates in KODE OS
This guide explains how updates to FDD Configs, Devices Points, Routines, and other FDD components are handled in KODE OS. All changes are tracked for transparency and troubleshooting. Important Before You Begin Always check if the specific point or ...FDD Faults on Mobile App
FDD Faults on Mobile FDD Faults on Mobile allows building operators, technicians, and facility teams to investigate, monitor, and manage recurring operational inefficiencies directly from the KODE OS Mobile App. Unlike Events, which are intended for ...Event Report
The Event Report page provides a centralized view for reviewing, investigating, and managing events. It combines device trends, event metadata, assignment controls, and collaboration tools to help users quickly understand what happened and take ...Historical Events Dashboard
The Historical Events Dashboard provides an overview of any events that have both started and then returned to normal in the building or portfolio. We will describe each widget on the dashboard, how data is calculated, and the options that you as an ...