FDD on Mobile App
Introduction
Fault Detection and Diagnostics (FDD) is a proactive approach for identifying and analyzing system failures or faults within a building's infrastructure at their earliest stages.
Navigate through FDD
Log into the Mobile App and you’ll land on the Home view. To access FDD data, tap on the FDD feature, which will take you directly to the FDD data view.
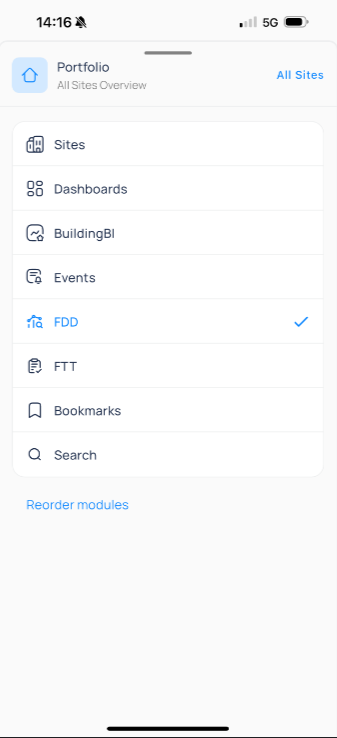
In this dashboard, the Fault Detection and Diagnostics (FDD) feature displays data in two primary formats:
Stream (the list of events)
Incidents (the list of incidents)
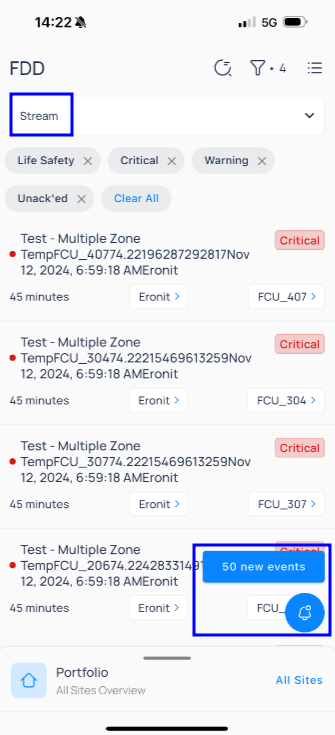
Stream Page
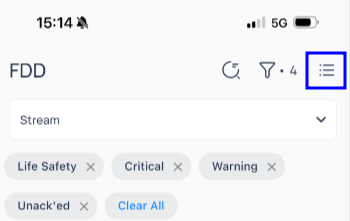
The Stream page offers a live overview of current events. Upon entering the FDD page, four filters (Life Safety, Critical, Warning, and Unacknowledged) are automatically applied, allowing you to refine the list by removing any filters as needed. You can also use the "Clear All" button to clear all events currently displayed on the page.
When new events are detected, a blue button appears, showing the count of new events. Tapping this button refreshes the Stream page to display the latest events.
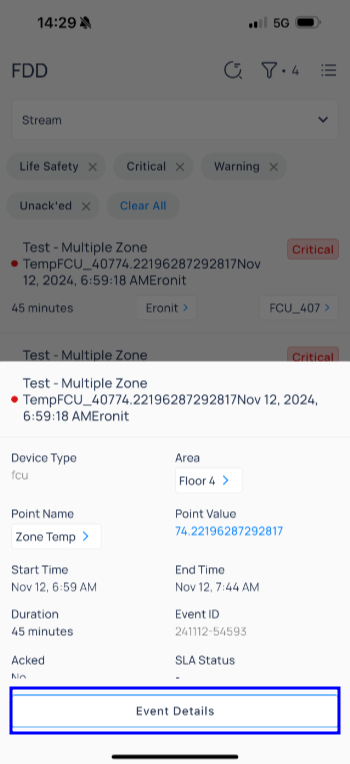
Clicking on any event will give you further details and the option to click on “Event Details” where you can get further details on that event.
Incidents Page
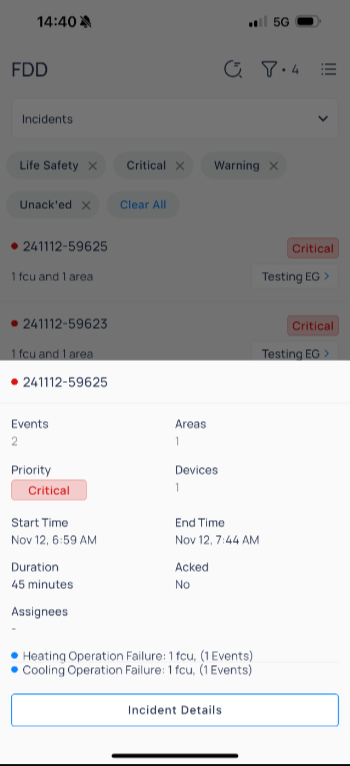
On the main page, you can switch between the Stream and Incidents pages. The Incidents page shows a comprehensive list of all incidents. Like the Stream page, it automatically applies four filters (Life Safety, Critical, Warning, and Unacknowledged) which you can adjust as needed to refine the list. There is also a "Clear All" button that clears all incidents displayed on the page.
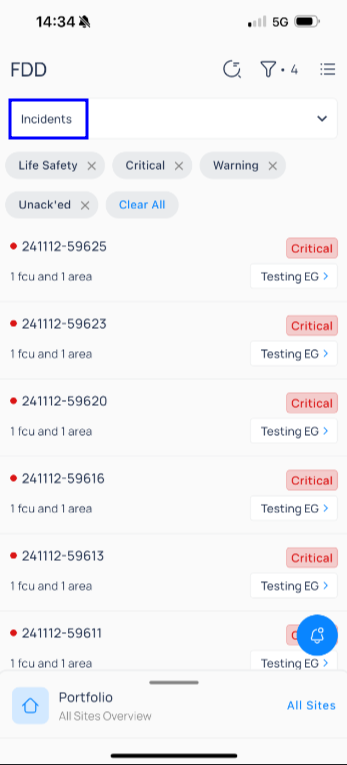
When you select an incident from the list, a view opens with more information about that incident. You can then click on "Incident Details" to see further details.
On the main page there are three options on the top right corner, the Search icon where you can search for any specific events or incidents.
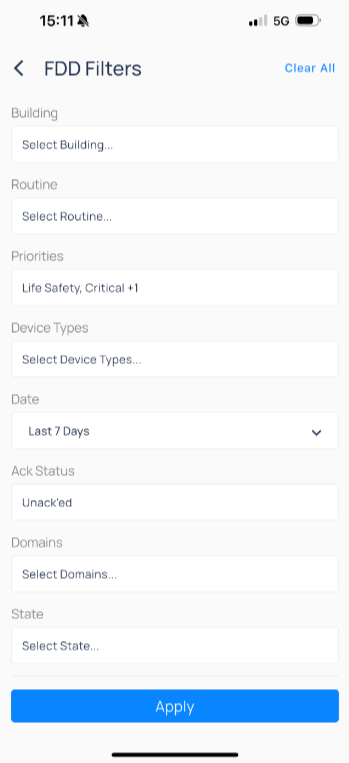
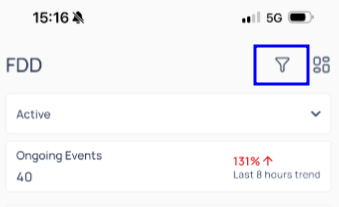
The Filter icon where you can filter the specific building, routine, its priority, device types, date, acknowledgment status, domains, status, and user.
Once you filter the data, click Apply to display the chosen data.
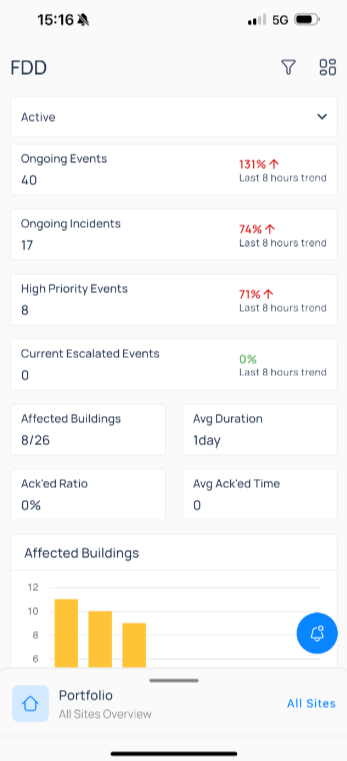
Through the last filter you can see all Active and Historical events through different widgets.
The Active Data
The Active Data Dashboard gives you a live overview of current events, high-priority incidents, and escalated situations. Through these metrics, you can observe trends from the past eight hours, empowering you to assess your building's status and take timely action to address any issues.
The Historical Data
The Historical Data dashboard mirrors the Active Data dashboard but focuses on historical trends, displaying daily averages of events, incidents, high-priority events, and escalated situations. It provides insights into affected buildings, event duration, acknowledgment ratios, and acknowledged time on a daily basis.
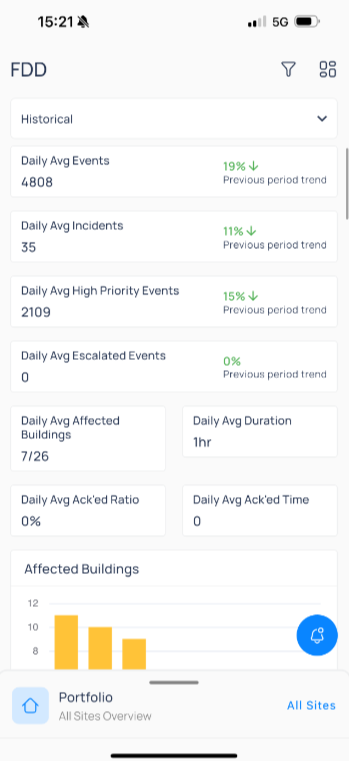
Using the filter icon positioned on the top right corner, you can refine your search by selecting specific building, routines, device types, priorities, acknowledgement status, domain and assignees. The filtered list of events will then be displayed on your screen.
Related Articles
FDD Faults on Mobile App
FDD Faults on Mobile FDD Faults on Mobile allows building operators, technicians, and facility teams to investigate, monitor, and manage recurring operational inefficiencies directly from the KODE OS Mobile App. Unlike Events, which are intended for ...Navigating to Area Insights - Mobile App
To obtain a visual representation of device placement across floors and other areas, and to interact directly with the devices, you can rely on Floor Plans. Each area will have its own Dashboard with various widgets. When you enter the Floor Plan ...Mobile App Navigation
Map View Upon logging into the Mobile App, you will land on the Map View if you have been assigned to more than one site. The Site home page will be displayed if you are assigned to only one building. Map View allows you to navigate to the building ...Events Options and Features
KODE OS monitors the operational health of your equipment 24/7 via event routines which cover everything from fan command failures to zone temperature off setpoints. The Events Dashboard is the central location in KODE OS through which you can view ...Sign in to KODE OS mobile app
In order to begin using the KODE OS mobile app you will need to set up and activate your account. Open up the KODE OS app on your mobile device Download and open the KODE OS mobile app on your iOS or Android device. Sign in to Mobile App On your ...