FDD Dashboard
Fault Detection and Diagnostics (FDD) is a proactive process that identifies and analyzes system failures or faults within a building's infrastructure at their earliest stages.
By detecting these faults early on, FDD enhances system performance, prevents future failures, and minimizes downtime for devices within the building.
FDD is increasingly recognized as a critical feature for optimizing overall system performance and reducing energy costs.
FDD Dashboard
To access the FDD dashboard, navigate to the left-hand side of the screen and select "FDD" from the available features.
In this dashboard, the Fault Detection and Diagnostics (FDD) feature presents data in these key forms:
Active Data
Historical Data
Stream Data
All Data
To access a comprehensive list of all events and incidents, simply click the "View all" button in the top right corner, where detailed tables of events and recent incidents are available.
On this page, on your left side, you can filter data based on your needs and export them at the end in CSV or PDF format.
While accessing the FDD dashboard for a specific site, you need to click on “Portfolio” icon on the top left-hand corner and search for the site of your liking, here you may click on the “FDD” feature on the left side and get the insights for that specific site that you have chosen.
Real-Time Data Dashboard
This dashboard provides a snapshot of ongoing events and incidents, high-priority events, and currently escalated events in real-time. Hovering over these numbers reveals trends for the past eight hours, allowing you to gauge your building's current situation and make informed decisions to mitigate issues.

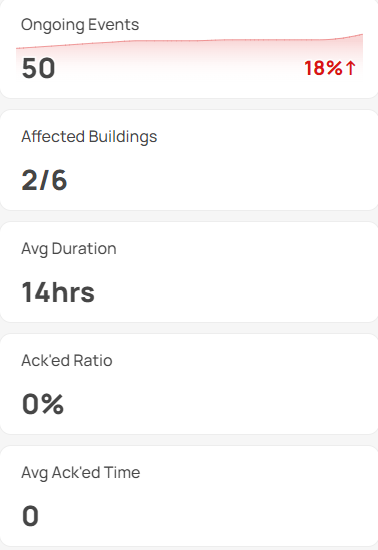
The Affected Buildings widget offers insights into the buildings impacted by faults. It displays the number of affected buildings and provides additional details about events in each building when you hover over it. Clicking on a specific building within this widget offers personalized real-time data for that building across all other widgets.

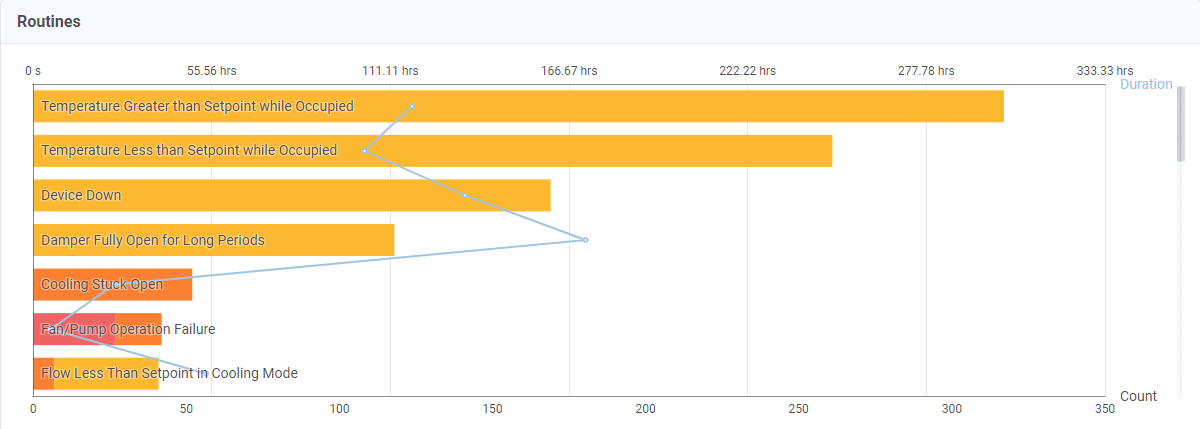
The Routines widget showcases faults detected in each building, such as Data Source Down, Device Down, or Temperature Greater than Setpoint while occupied. Hovering over these routine faults reveals more event details, and clicking on one of them personalizes all other widgets with real-time data.
The Priority widget, equally crucial, visually represents fault priority. Clicking on it also updates real-time data in other widgets.

The Affected Device Types widget displays faults detected on individual devices within buildings, with the same interactive functionality as other widgets mentioned above.


The Resolution widget presents the acknowledged and unacknowledged events, if you hover over it you will find the numbers.

The Duration and Count Overview widget provides graphical representations of acknowledged and unacknowledged events in each building, as well as the duration of these events. It also distinguishes between escalated and non-escalated events.

The Table View widget offers real-time data on current events and incidents. It includes Event ID, the affected building, specific area, event priority, device details, start and end times, event duration, and acknowledgment status.

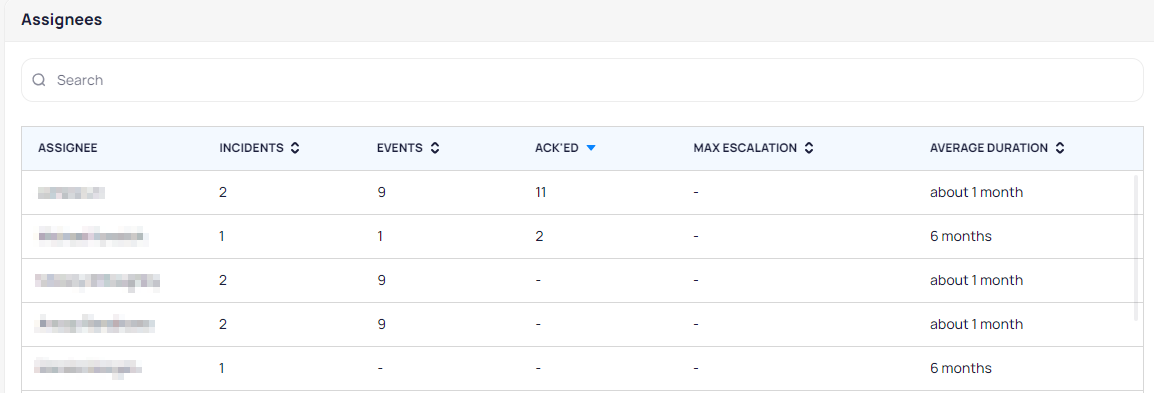
The Assignees widget shows a table where the assignees are listed and further details regarding the number of incidents, events, acknowledgment, max escalation, and average duration are listed as well. Here is a screenshot of the Assignees table:
Historical Data Dashboard
The initial button on this page, located in the top right corner, is the embedded calendar for the dashboard. It allows for the customization of data viewing by offering options such as yesterday, the last 2 days, 7 days, 30 days, data for the current month, or the ability to define a custom date range.
“Choose Users” window allows you to select a specific user where all other widgets will be personalized with the data of that user.
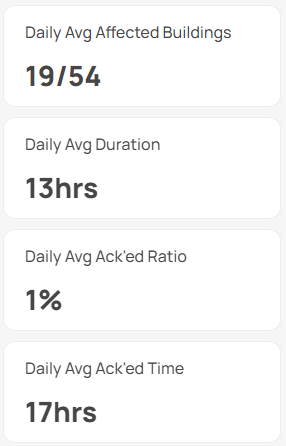
The Historical Data dashboard mirrors the Real-Time Data dashboard but presents historical data daily. It averages the number of daily events, incidents, high-priority events, and escalated events.
Here, you can view daily averages for affected buildings, event duration, acknowledgment ratios, and acknowledged time.
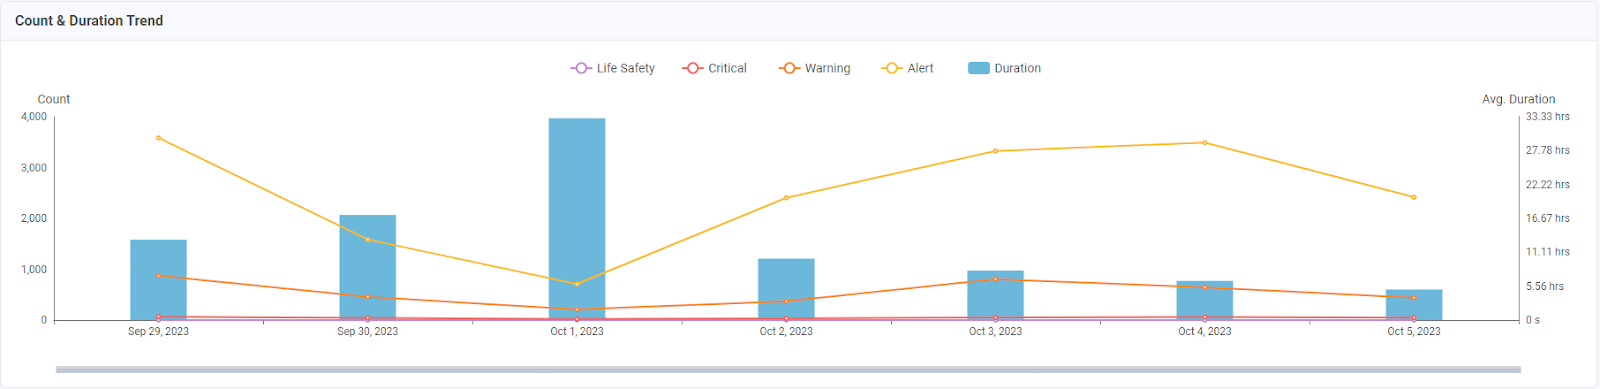
This dashboard includes a Count & Duration Trend widget, which allows you to visualize critical, warning, alert, and event durations graphically. Additionally, you have the flexibility to customize the date range to view these specific details.
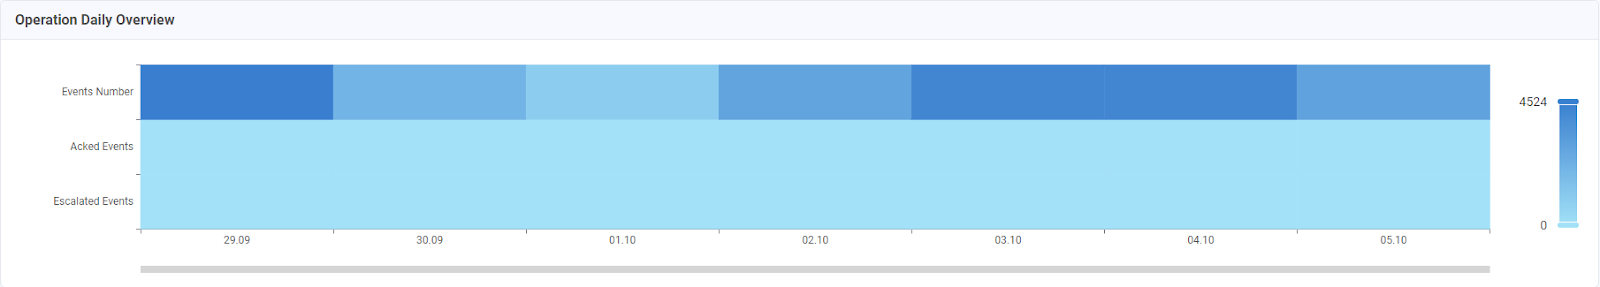
The Operation Daily Overview widget displayed in a tabular graphical format, enables you to track daily event counts, acknowledged events, and escalated events.
By streamlining fault detection and diagnostics through the Kode FDD Dashboard, you gain valuable insights and tools to enhance building system performance, minimize disruptions, and optimize energy usage for our clients.
Related Articles
What is FDD?
Understanding Fault Detection & Diagnostics What is a Fault? A fault is a period of time in which a specified condition is true on a specific device. For example, this is a fault: @8:00am AHU-1 Could not maintain discharge temperature within setpoint ...Event Streaming
The FDD Streaming View provides the classical interface for monitoring building notifications along with a number of preference settings to adjust the view to needs of the portfolio or user. Highlights Automatic Refresh Streaming comes with an option ...Navigating through the Site Dashboard
The Site Dashboard is the main menu for a building which is displayed after selecting a desired building from the building cards on the map view. The menu is broken down and organized into widgets which represent a feature of KODE OS filtered for the ...Customizing Dashboard Widgets
The Dashboards can be customized to your liking, and allows you to add a number of different widgets based on what you want to have the quickest access to, from a single view. Below you will find instructions on how to add and modify some of the most ...Using the Energy Dashboard
Depending on your user privileges as well as company subscription, you may be given access to an additional module called Energy Dashboard which shows data for energy consumption (inclusive of power, water, steam, gas, etc.) at the building level as ...