Events Module
Event Configuration
The goal of event configuration is to establish monitoring and alarming on any of the newly integrated pieces of equipment. Follow the below steps to configure events of your choice.
1. Navigate to the Events icon through the left navigation bar.
2. Click on the three dots in the top right corner of the page that opens up > from the drop-down menu select the Create Event button.
3. Select your building of choice from the Buildings menu on the left section to see the list of applied events.
4. Select the routine you would like to enable from the Routines menu in the right section, based on:
The installed equipment (VAV, AHU, Boiler, etc)
The points available on that equipment (Occupancy, Dual Setpoint, etc)
Any monitoring goals such as temp low/high limit, fan cmd failure, etc
5. Click on Next and you will see 2 columns for event configuration.
A list of all devices that have not yet had this event applied. (Auto-filtered based on the event routine selected).
A list of all selected devices to apply this routine.
A list of points available on the selected devices.
A list of point templates that are required to enable this routine.
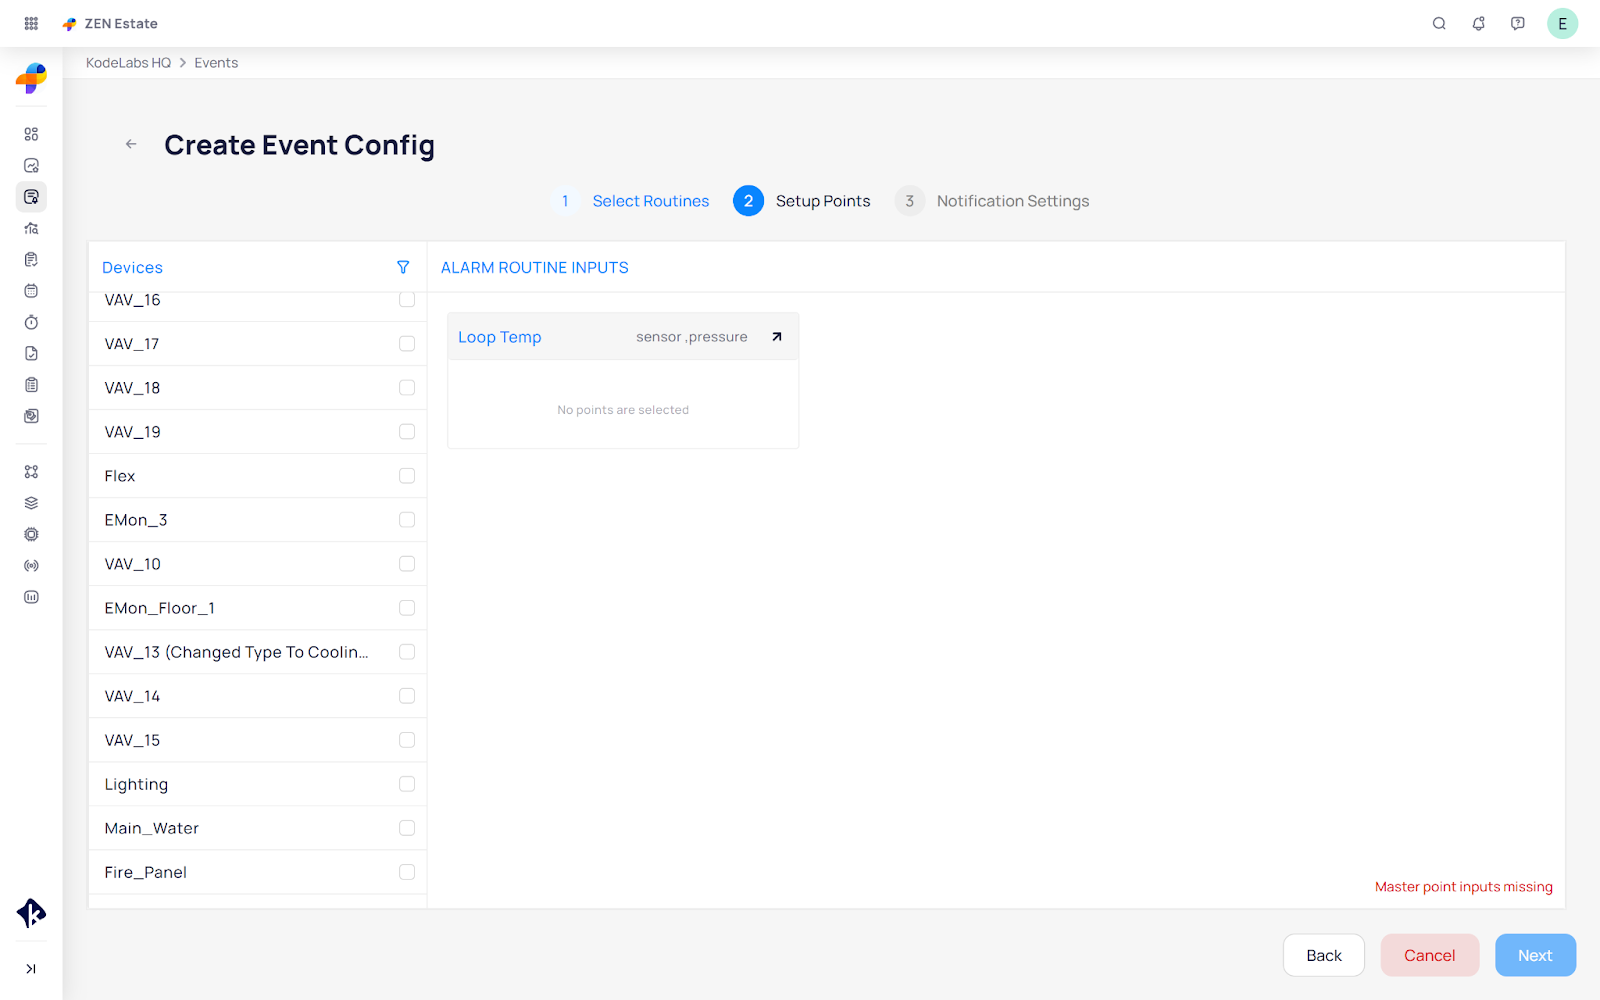
6. Select the devices from the first column that you would like to apply the routine to.
7. Once you choose your devices, click on the select button to select the points.
Click on Folder Icon to see and select points on Grouped View.
Click on the Four Lines Icon for the Split View.
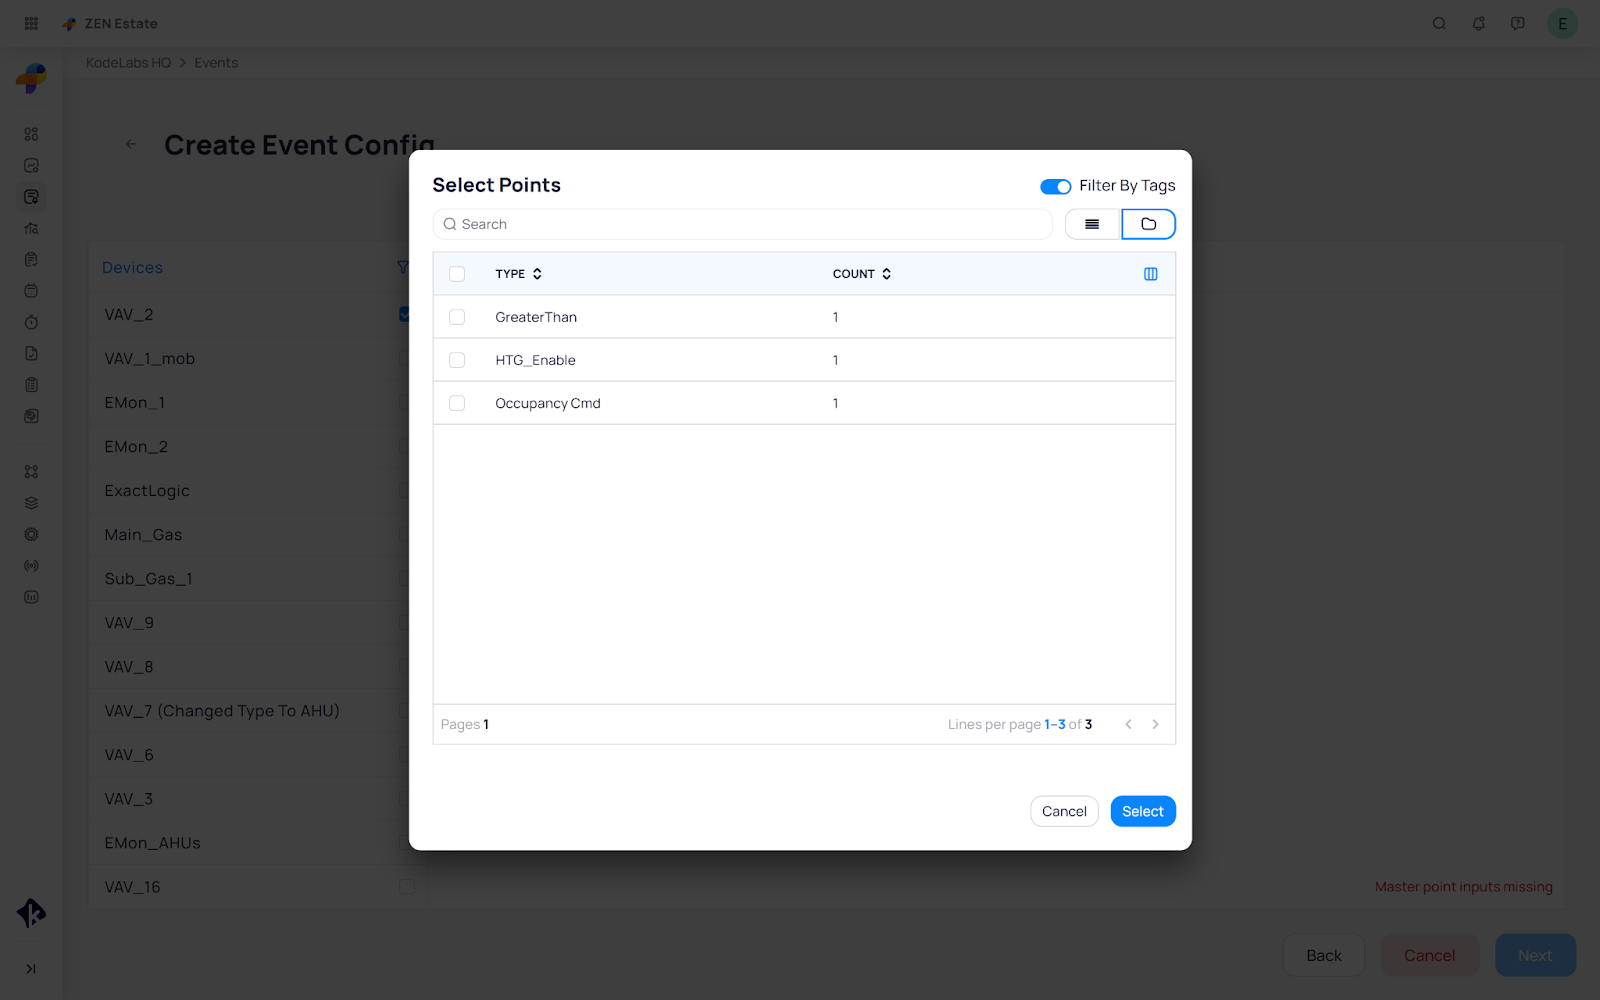
8. Click Select and your point will appear in the Point box.
The color codes of green, blue, and orange correspond to bool, number, and string points as indicated.
The point templates will use this same color scheme to indicate the required type.
The number to the right of the point name indicates how many devices have that point.
9. After you have selected all the points, click Next to go to Notification Settings > Select Event Class (APIEventClass, Communication, HVAC, Fire, or Generator).
10. Each Class Event has a User Role Specification of who will receive notifications.
11. To add a user to receive notifications Click on Add Specific User.

12. From notification settings, click Next to maintain the current settings, or use the provided templates to adjust as needed.
Routines
To see the logic block (Routines) of the event trigger go to the Event Page and click on the three dots at the top right-hand corner of the screen.
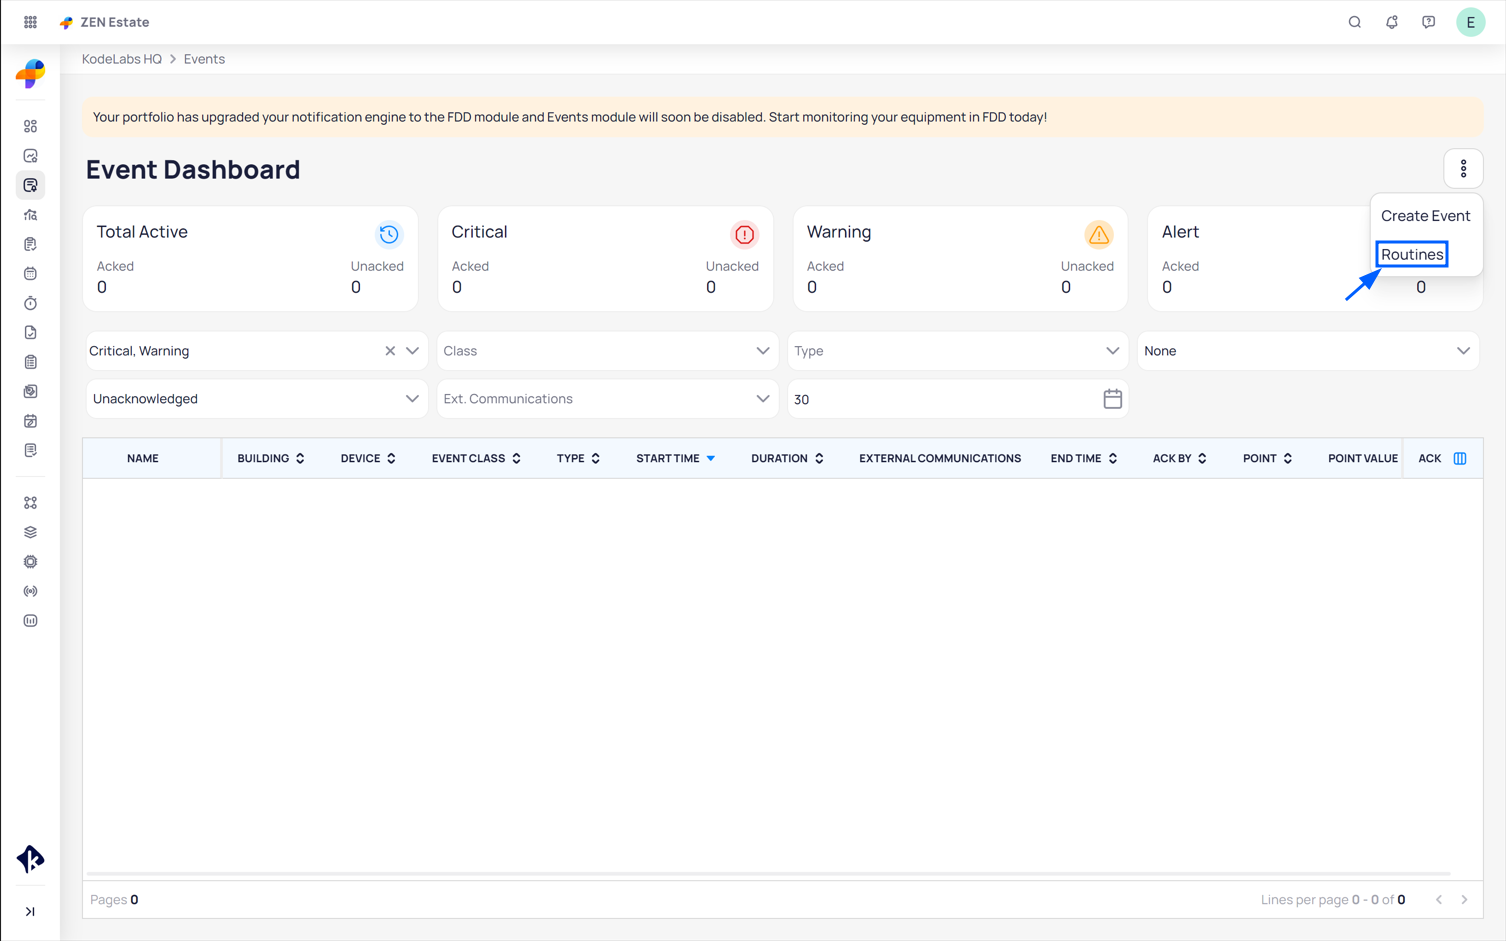
Here you will see the list of all Routines, by clicking on the three dots at each of the Routines on the dropdown you will see three options:
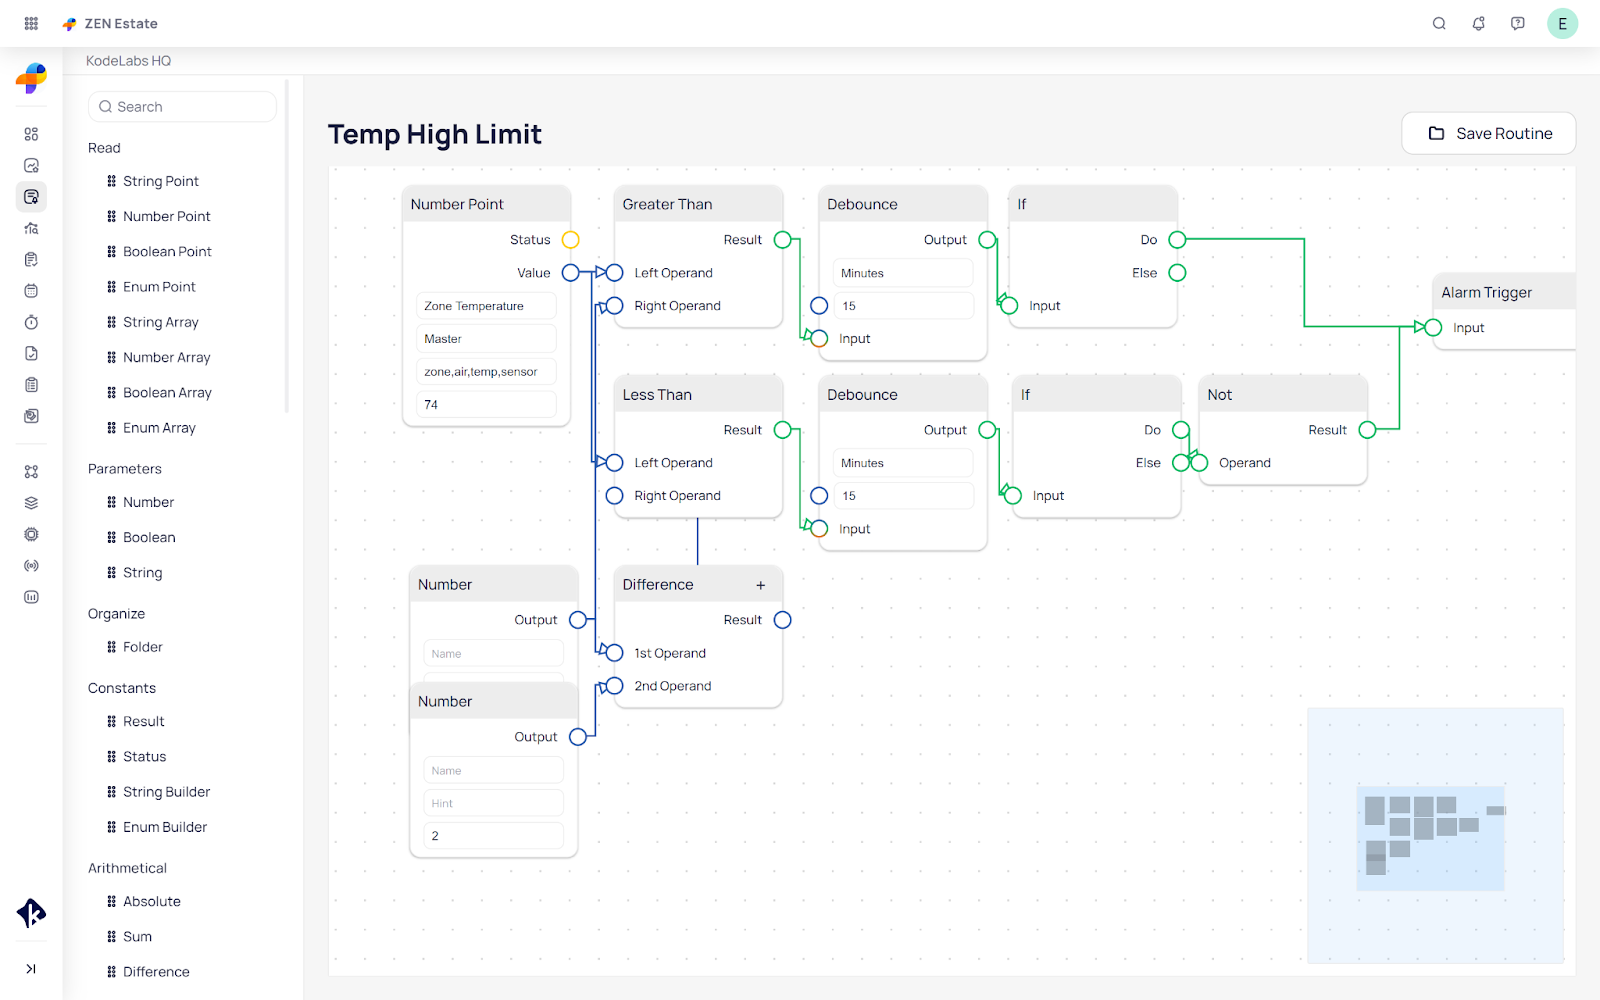
Edit Routine
Duplicate Routines
Delete Routine
Click on the Edit Routine and you will be directed to the logic block.
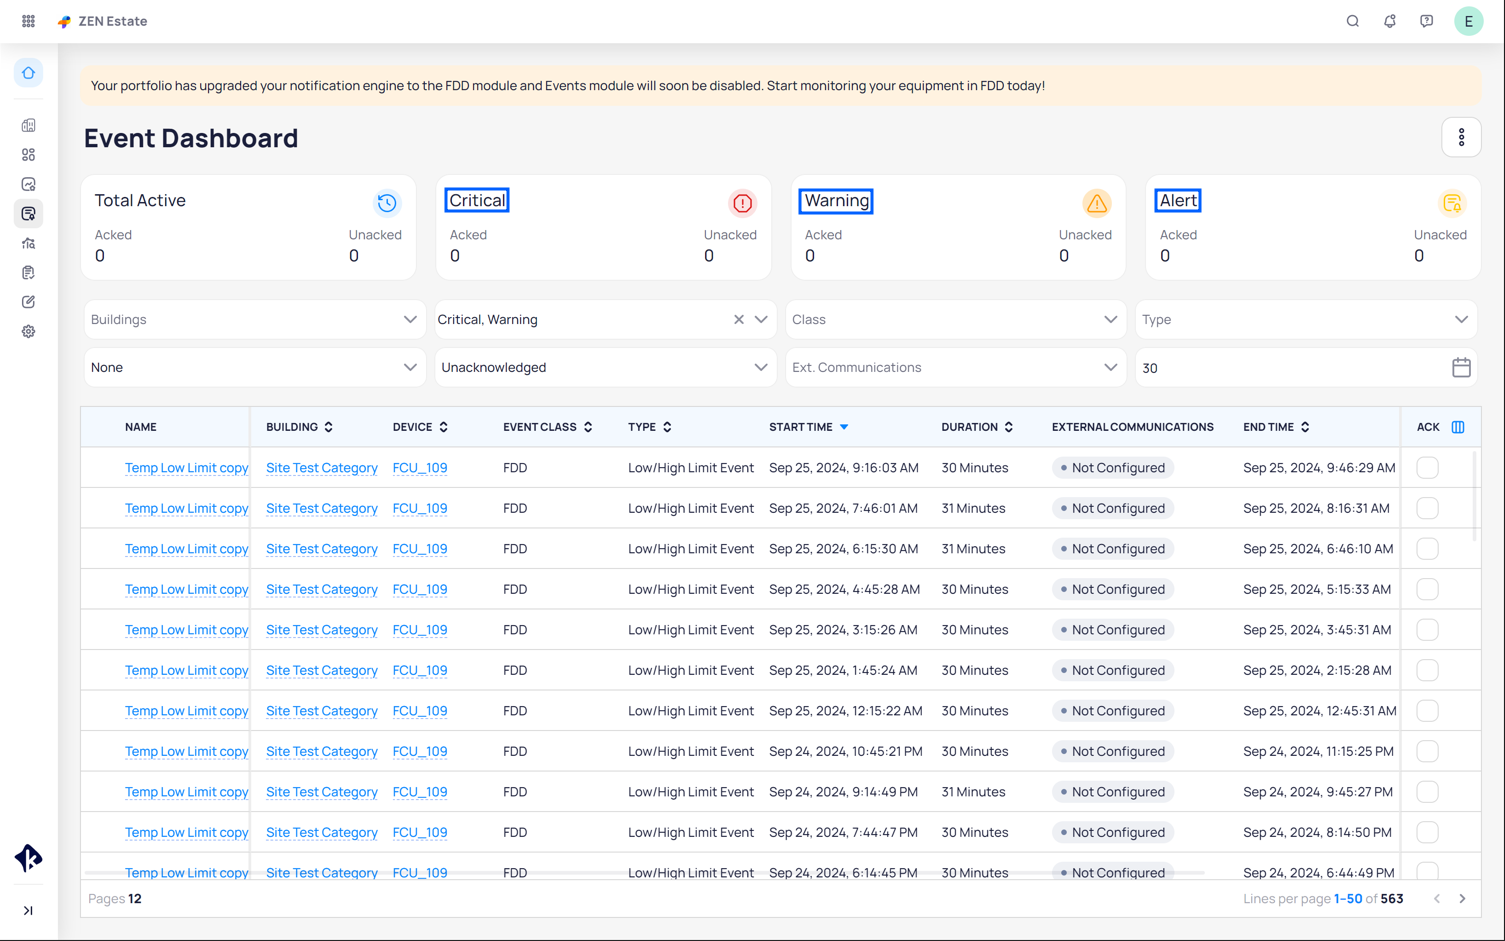
Using the Event Dashboard
KODE OS monitors the operational health of your equipment 24/7 via event routines which cover everything from fan command failures to zone temperature off setpoints. Through the Events Dashboard in KODE OS you can view all active and historical events across your portfolio.
To access site events, click on the "Portfolio" button situated in the top left corner. Search for the specific site, then proceed to navigate through the “Events” feature listed on the left. Here, you will find detailed information regarding events within the respective site displayed on the page.
Events are categorized in three categories as follows:
Critical Events are those that are defined as having an immediate and/or severe impact to the building operations.
Warning Events are those that identify equipment inefficiencies or operational failures that may affect tenant/occupant comfort.
Alerts identify equipment inefficiencies that may cause potential energy inefficiencies.
Filtering and Finding Events
Selecting any of the available filters on a specific building will only display corresponding events in the list below. You can see that in each filter there is a number of events in parenthesis which shows the number of events that fulfill the criteria.
Filtering can be done based on:
Event Category
Class
Type
Active or Inactive
Acknowledgement status
Ext. Communications
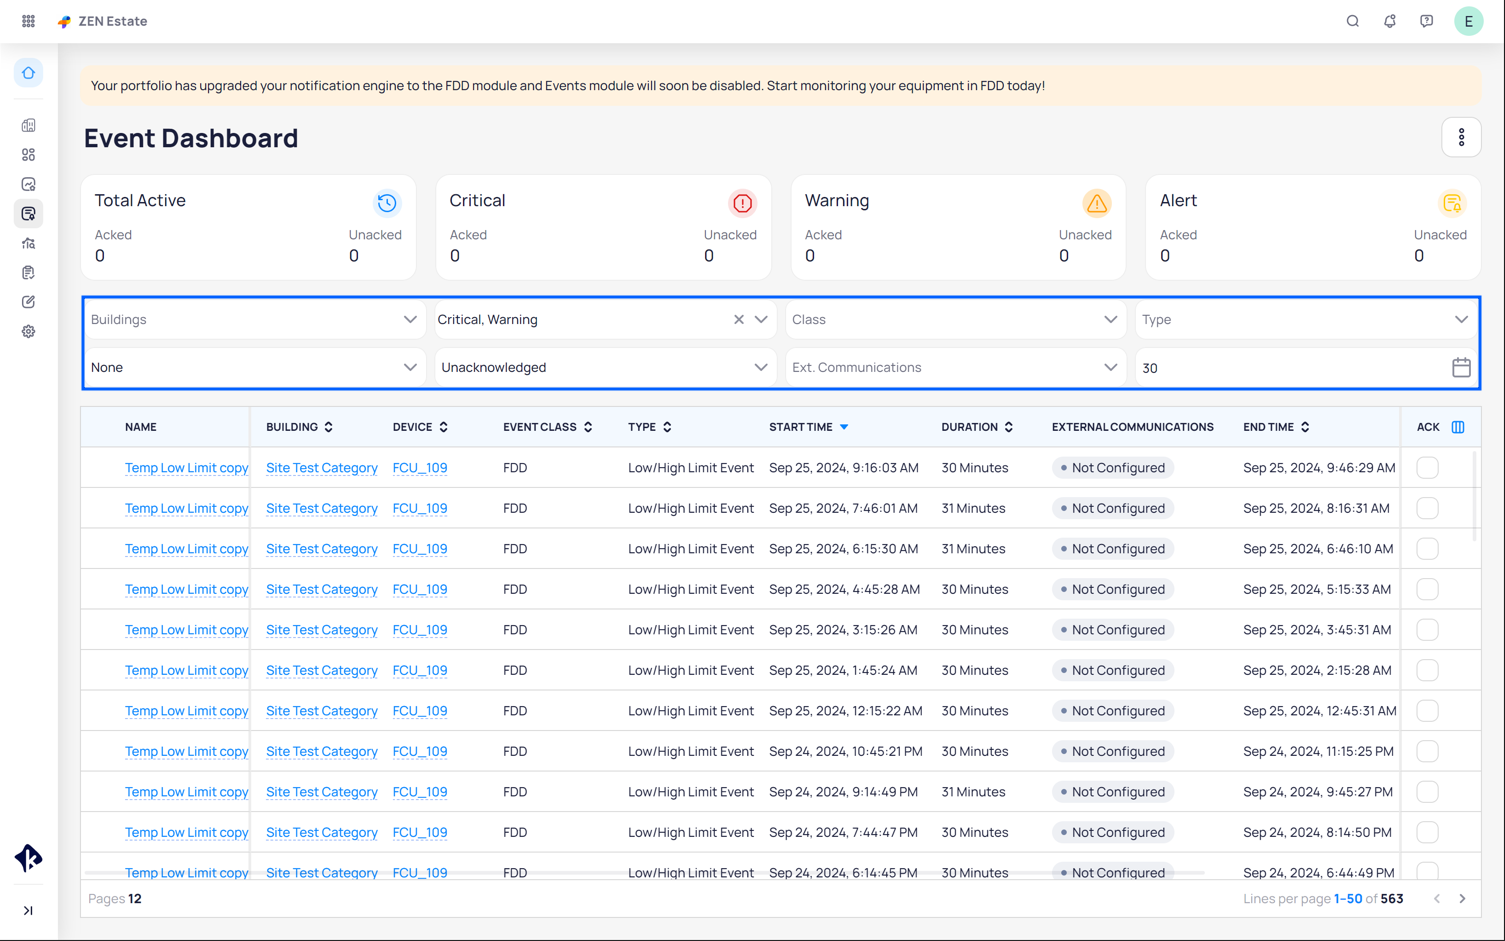
Furthermore, you can pick up the date of your liking to filter events on the events list below through the embedded calendar window.
Acknowledging an Event
An event, regardless of its category, can be acknowledged or unacknowledged. Acknowledging an event means that you have taken the responsibility to inspect the device and/or the system associated with the event and will ensure that it is resolved. You can acknowledge an event by selecting the box on your left side on the events list and saving them as acknowledged events.
Please see the screenshot below on acknowledging an event.
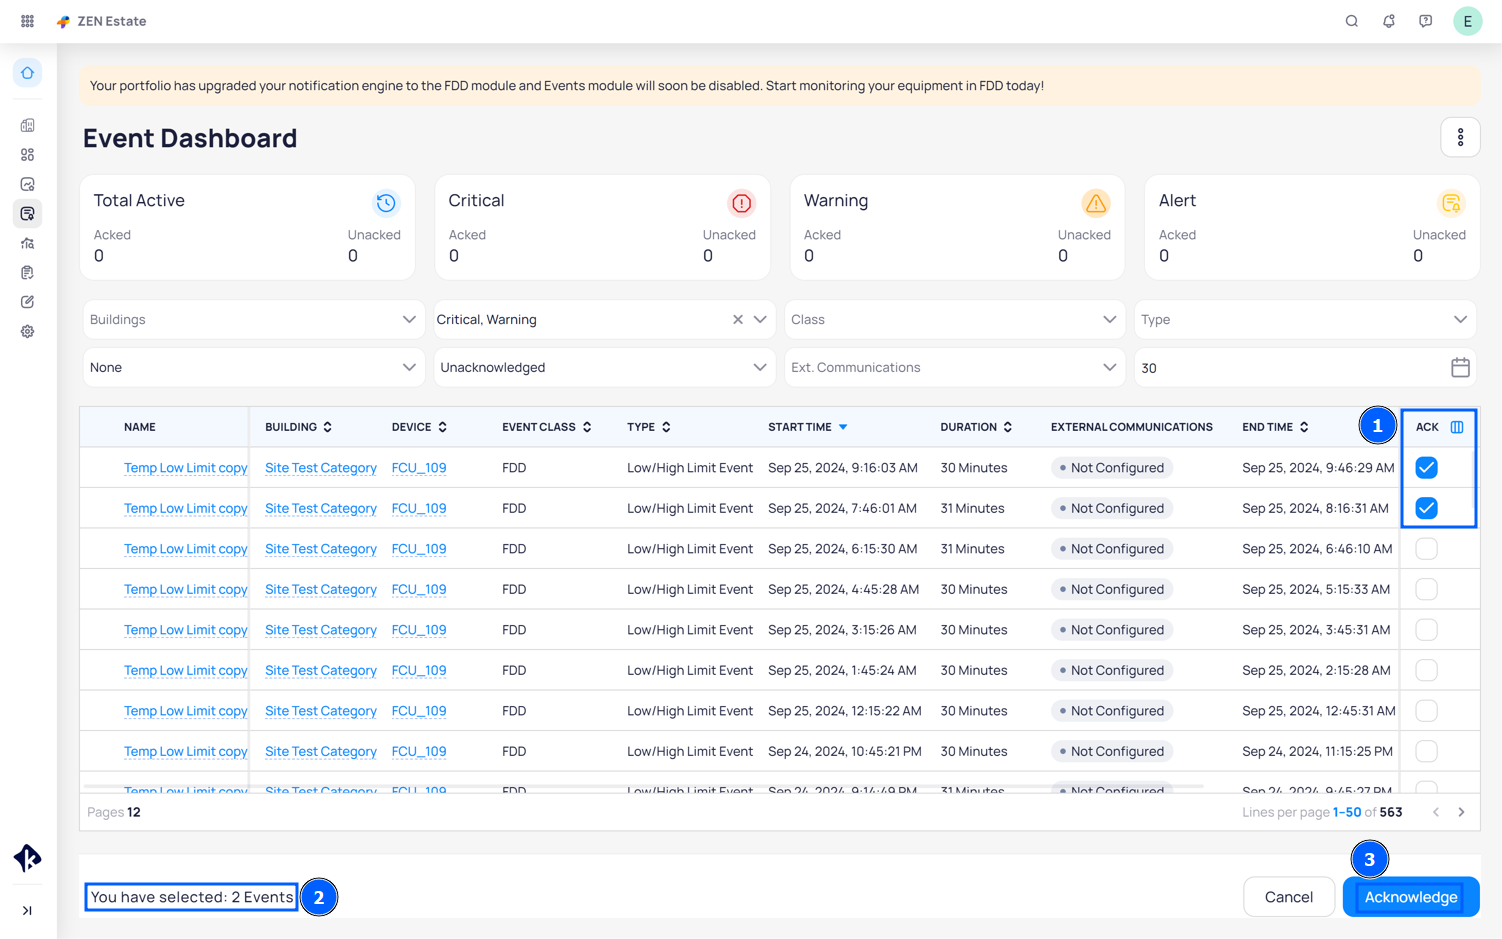
Once you hit the “Acknowledge” button, events will be listed as acknowledged events. It is important to know that this does not resolve the events itself. Event resolution is achieved automatically once the reported cause is corrected.
Navigating Events
Navigating through the events list is simple. Selecting an event from the event list will take you to the Event’s Details page which will provide all general information, severity and time displayed graphically, and event escalation. The screenshot below illustrates an example of event details.

Related Articles
Events Options and Features
KODE OS monitors the operational health of your equipment 24/7 via event routines which cover everything from fan command failures to zone temperature off setpoints. The Events Dashboard is the central location in KODE OS through which you can view ...FDD User Manual
Understanding Fault Detection & Diagnostics What is a Fault? A fault is a period of time in which a specified condition is true on a specific device. For example, this is a fault: @8:00am AHU-1 Could not maintain discharge temperature within setpoint ...Event Streaming
The FDD Streaming View provides the classical interface for monitoring building notifications along with a number of preference settings to adjust the view to needs of the portfolio or user. Highlights Automatic Refresh Streaming comes with an option ...Audit Module
Audit Feature The Audit Module allows users to view actual and historical data of related devices and points in a straightforward manner. To create an audit template including the device type and points of your choice please follow the below steps. ...Bookmarks
You can use bookmarks to quickly find and jump back to a specific device, or floor plan widget instead of scrolling through multiple pages. With Bookmarks, you can use it as a navigational tool, as well as a link or reference. Bookmarks are marked as ...