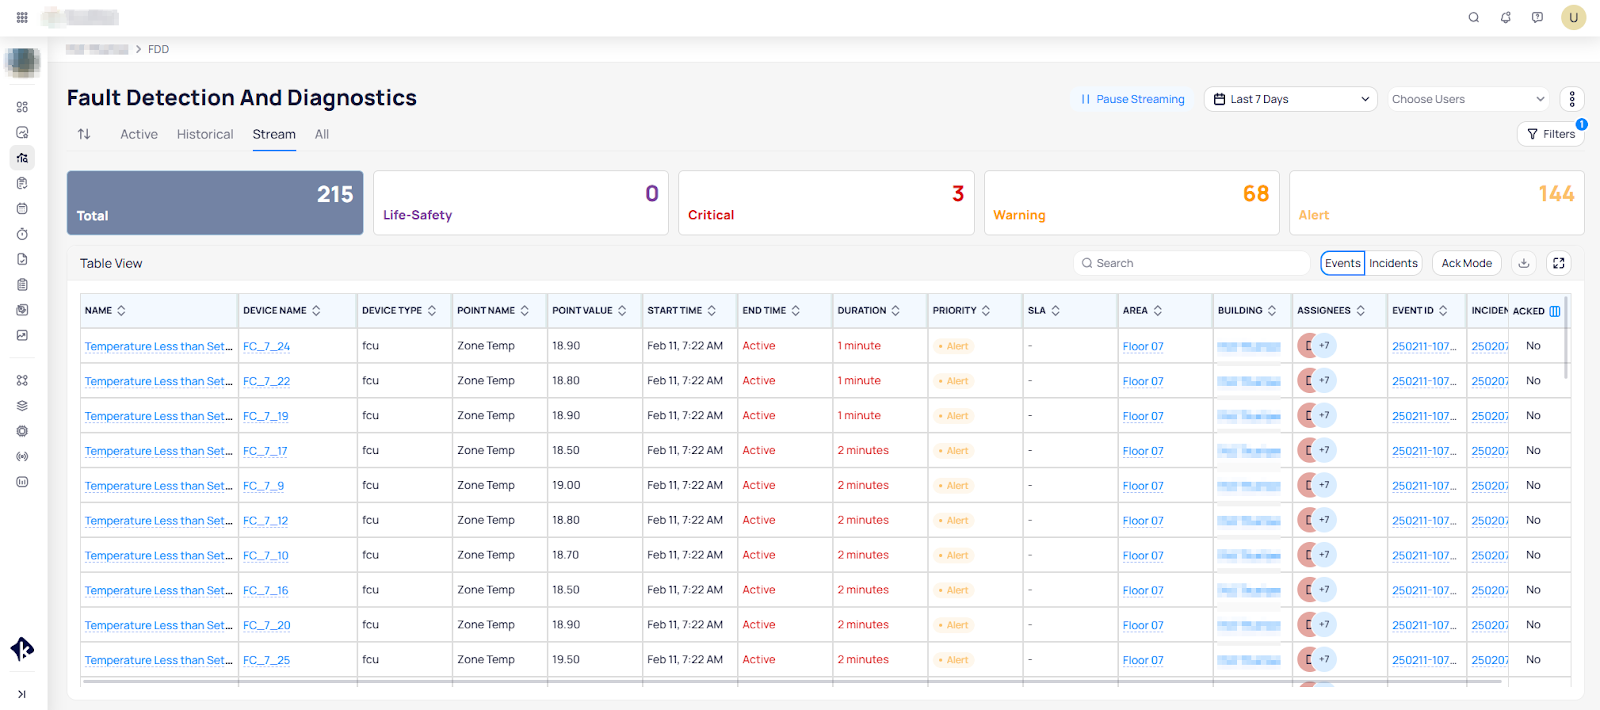
Event Streaming
The FDD Streaming View provides the classical interface for monitoring building notifications along with a number of preference settings to adjust the view to the needs of the portfolio or user.
Highlights
Automatic Refresh
Streaming comes with an option to automatically refresh the table view every 1, 2, 5, or 10 minutes enabling users
to keep this screen open at all times.
Simple User Interface
The classical table view provides a simple interface that works for retail sites, small deployments, commercial offices,
critical systems like data centers and health care facilities.
User & Portfolio Preferences
The Streaming update includes several user and portfolio preferences to optimize the interface including user,
building, portfolio filters, status tracking, and customizing the FDD landing page.
Features & Functionality
Event Streaming introduces several new functionalities to enhance the user experience with the table view.
We will go through them one by starting from the top left of the UI and going left to right as we go down the page.
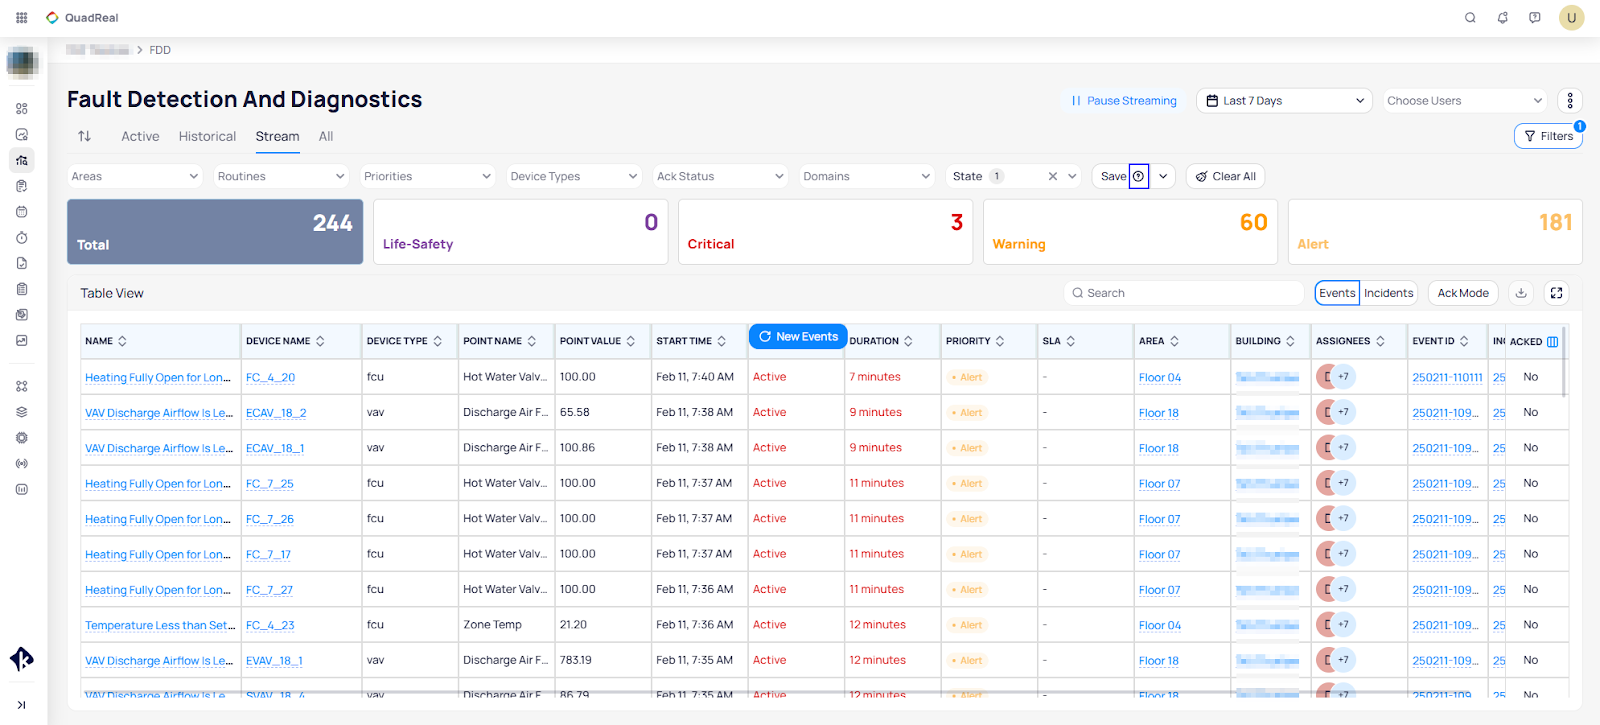
Pause Stream / Resume Streaming
Located at the top of the page, the user can choose to pause or resume streaming. While streaming is active, this page will continuously update with new Alarms. The user can filter while streaming but will be unable to sort.
Pausing the stream will hold new alarms in the background until streaming is resumed or the page is refreshed. While paused, the user can sort and export up to 1,000 alarms at a time.
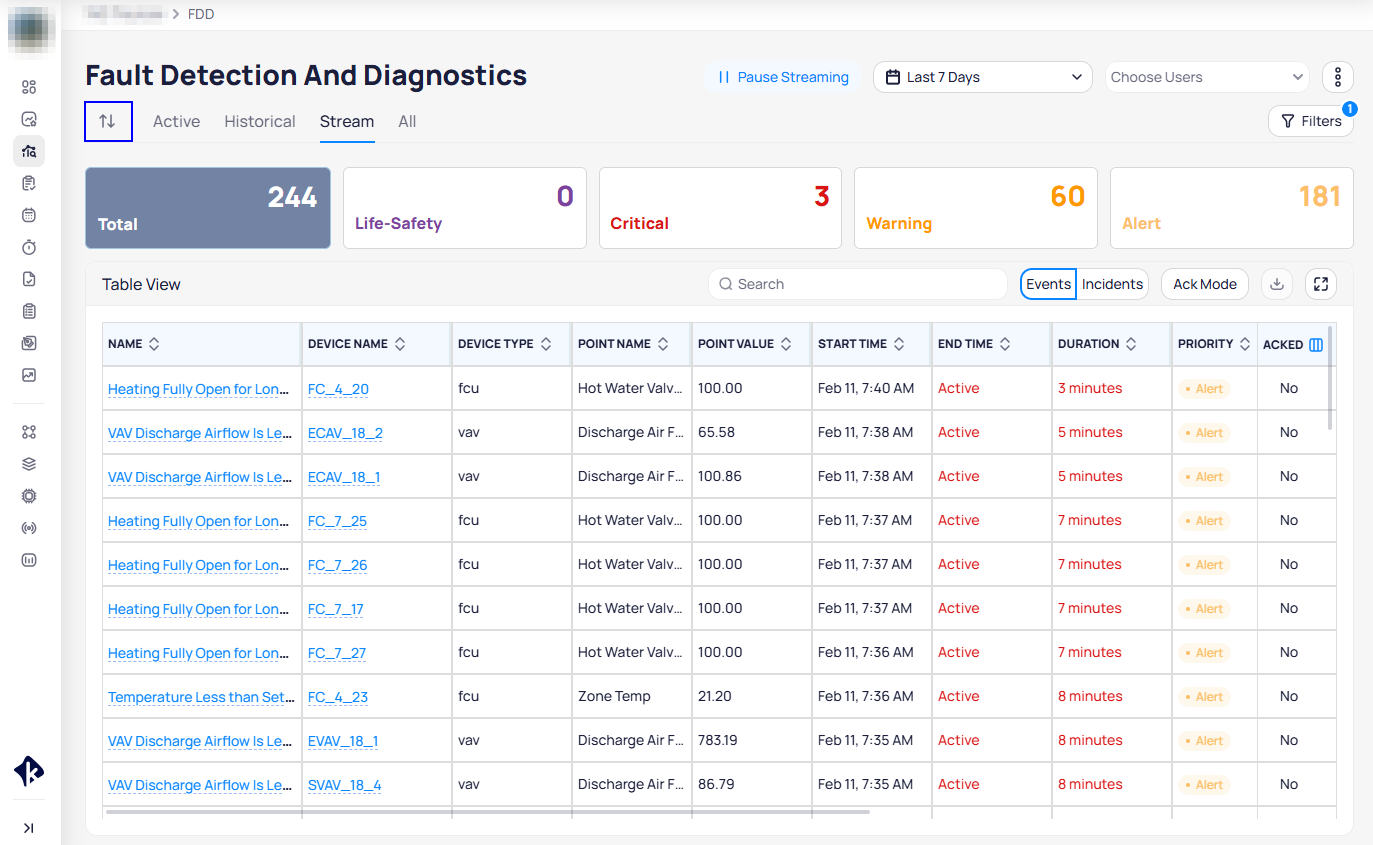
Set User Preference for Page Order
Using the up-down arrow directly below the Fault Detection and Diagnostics page header, users can now set their preference for page order, including the ability to set the landing page by choosing which page (Stream, Active, Historical, and All) appears first in the order.
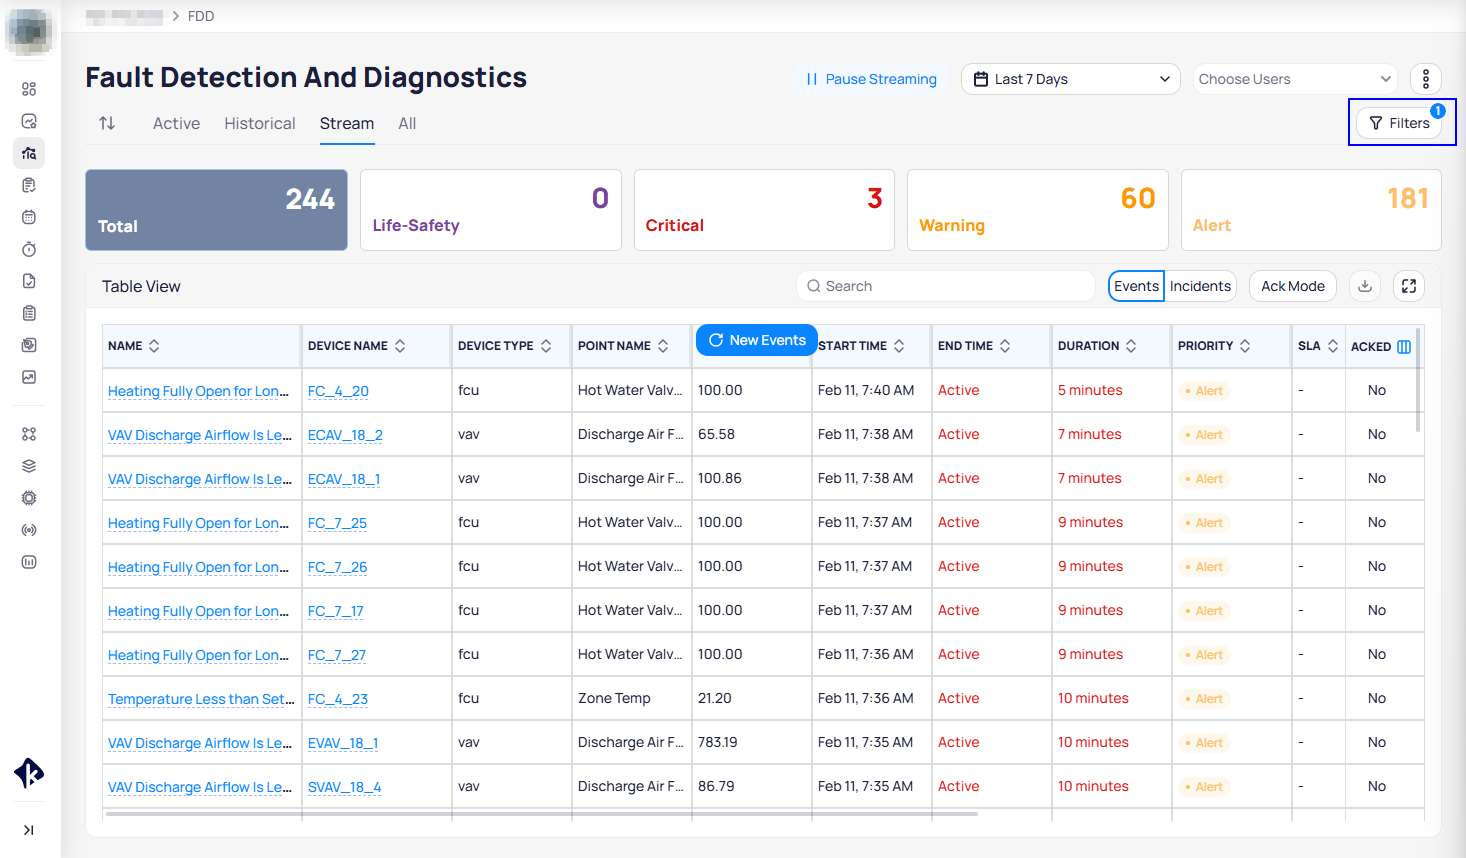
Updated Filtering UI
When clicking the filter button on the right-hand side of the page, a series of dropdown filter options will appear for the user to select.
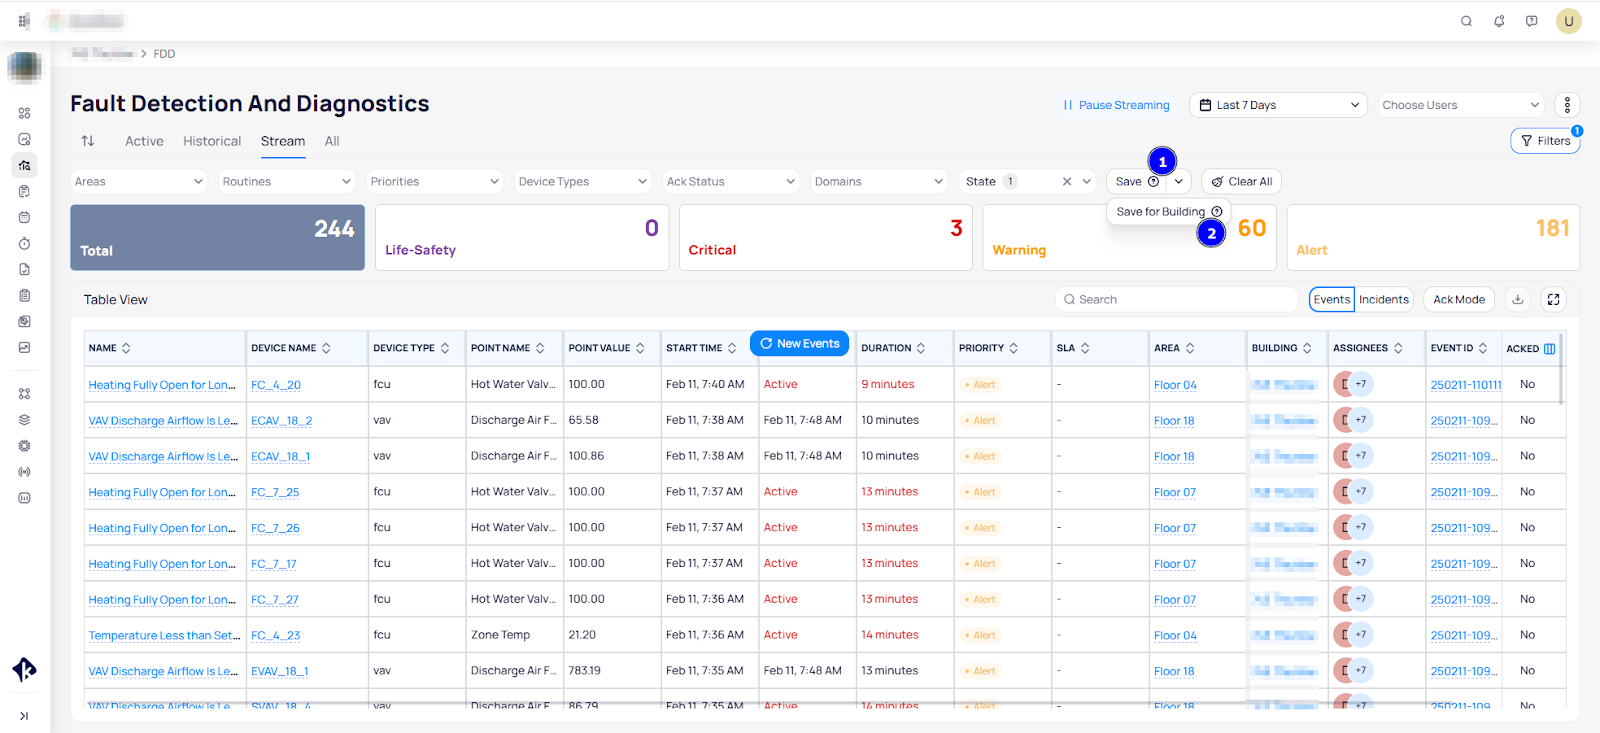
Saving User, Building, and Portfolio Filters
Users can now save filter preferences for themselves, the building, or the portfolio view. Simply apply your filters and use the Save button to save the defaults for yourself, your building, or portfolio.
User Default Filters
This can be extremely useful when there are multiple user roles monitoring faults in the building such as energy, security, and building operators. Allowing each user to have a customized slice into the faults of interest.
Portfolio Default filters
Portfolio preferences apply ONLY to the Portfolio View of FDD. It does not apply to every building in the portfolio. Similarly, the building preferences do not apply to the portfolio view.
Notes: The Event Count updates dynamically with the filters you apply. I.e. if you filter for a specific routine the event count across Critical,
Warning and Alert will be updated accordingly. If you apply a priority filter for Critical only, it will display a count of 0 on cards.
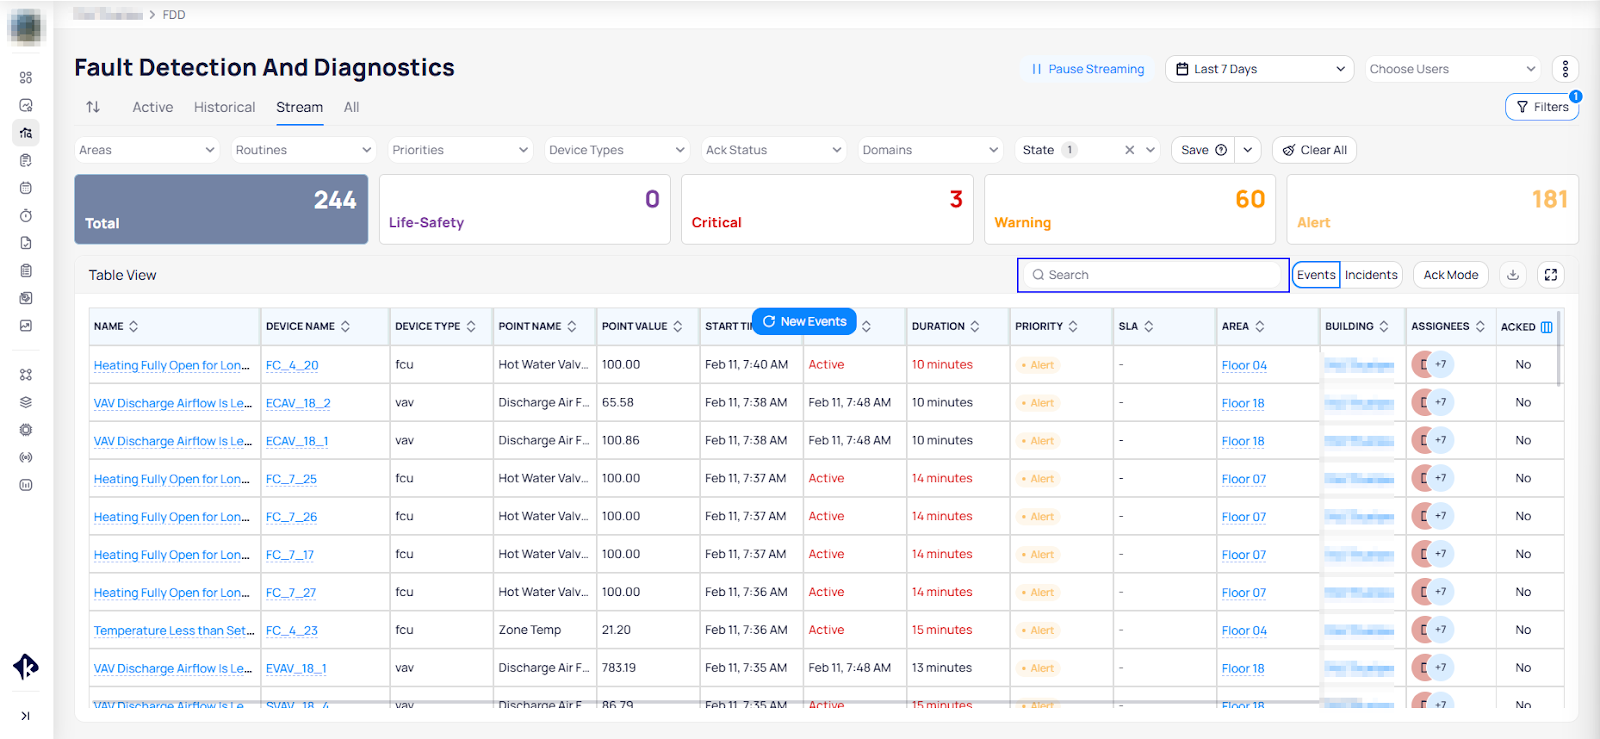
Clickable Priority Cards
The priority cards are now clickable and can be applied as filters to the Stream. Clicking these cards will automatically update the content of the filter drop down and they can be used interchangeably.
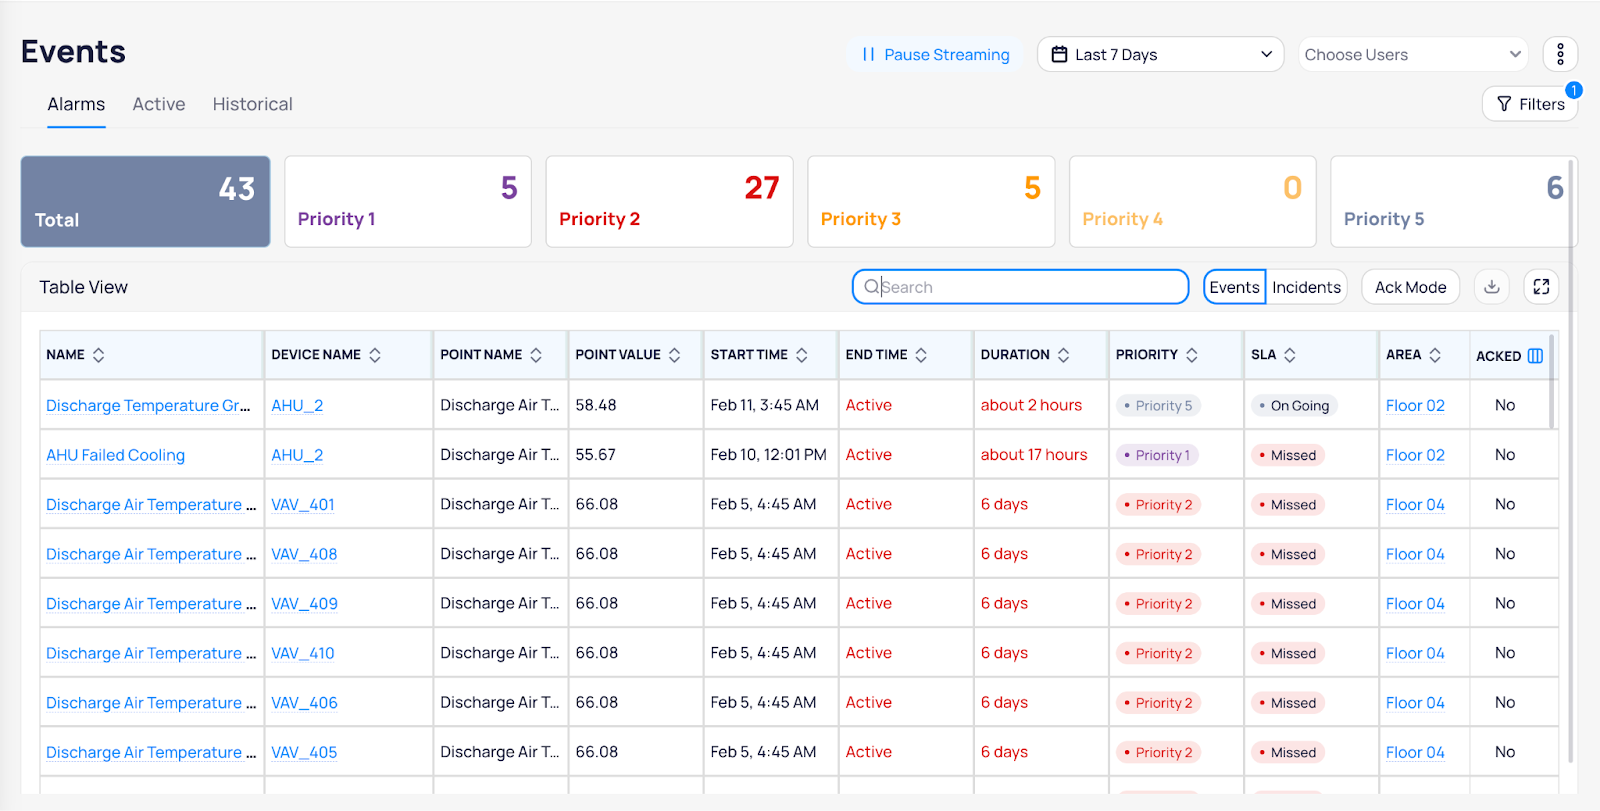
Improved Search
Users can search the event stream by Event Name, Device Name, and Building Name.
Bulk Acknowledge
Users can now bulk acknowledge Events. Simply click the Ack Mode button and multi-select the events you want to acknowledge.
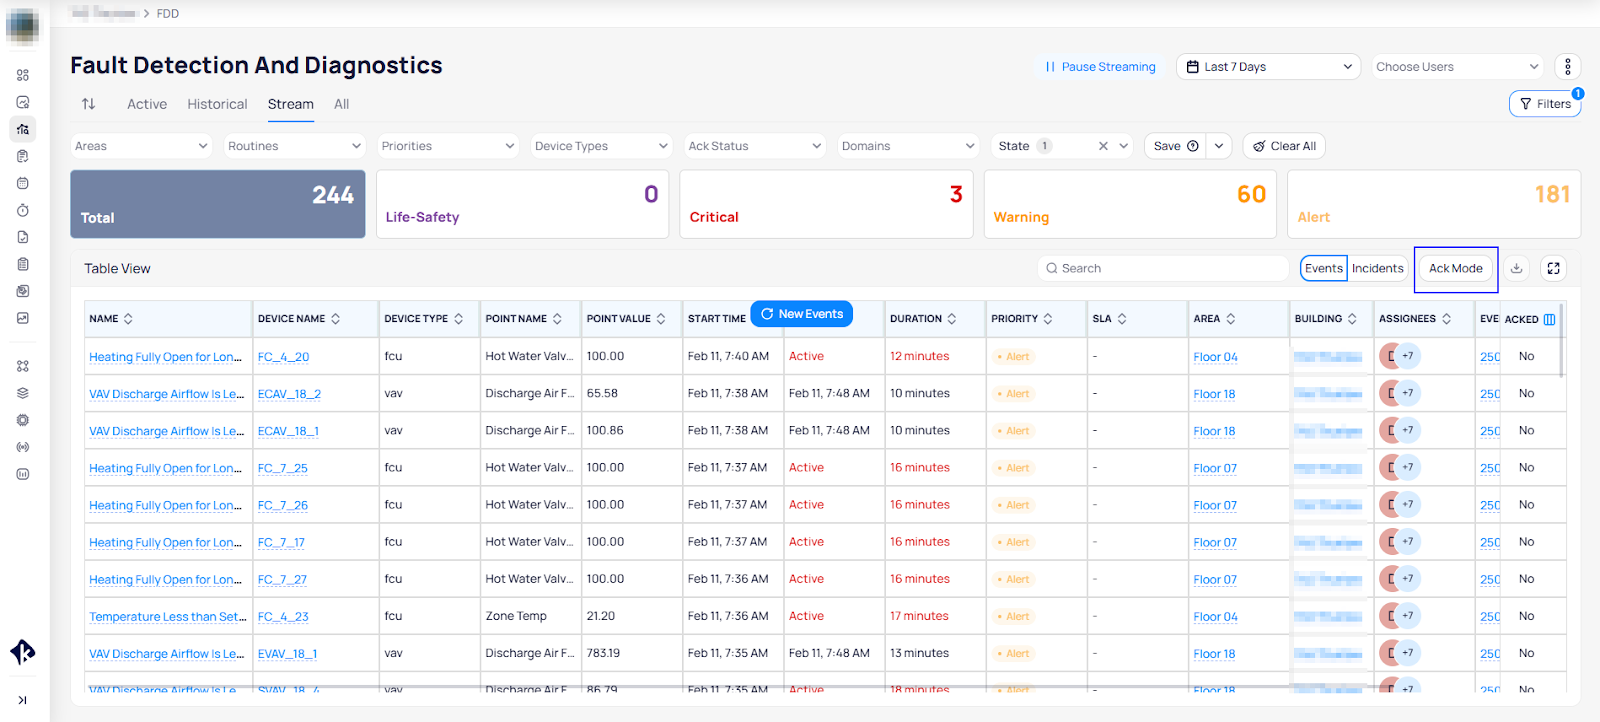
You can multi-select, by using the select all button at the top of the page or by using shift-click to select a range of events.

Export
Users can export alarms by first pausing streaming and then selecting the download arrow from the table view. Users can select their columns and export up to 1,000 alarms at a time in either CSV or PDF format. Any filters currently applied to the dashboard will also be applied to the export list. I.e. filtering for a specific routine, device type, or priority, your export will only show the alarms that match those conditions.
Full Screen
Last, but not least, we have added a full-screen mode if you would like to maximize the list view to be the entire window.
To go into full-screen mode, click on the button in the upper right corner.
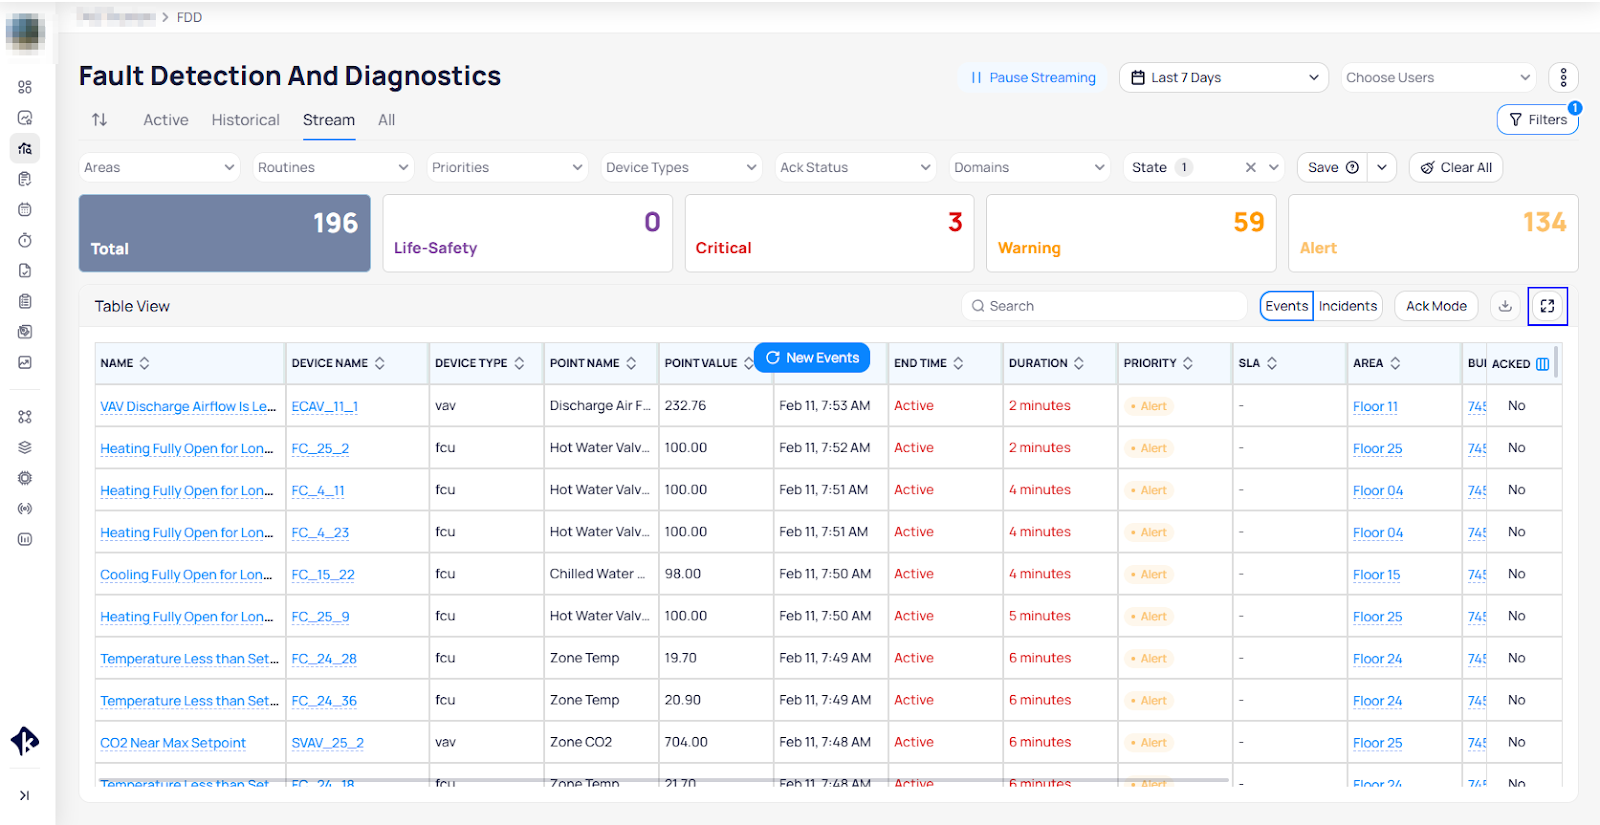
Table View

Related Articles
Events Options and Features
KODE OS monitors the operational health of your equipment 24/7 via event routines which cover everything from fan command failures to zone temperature off setpoints. The Events Dashboard is the central location in KODE OS through which you can view ...Historical Events Dashboard
The Historical Events Dashboard provides an overview of any events that have both started and then returned to normal in the building or portfolio. We will describe each widget on the dashboard, how data is calculated, and the options that you as an ...FDD User Manual
Understanding Fault Detection & Diagnostics What is a Fault? A fault is a period of time in which a specified condition is true on a specific device. For example, this is a fault: @8:00am AHU-1 Could not maintain discharge temperature within setpoint ...Customize Event Dashboard
You can customize the Event Dashboard to your liking in Settings by clicking the More icon. Customize the Event Dashboard by clicking the More icon on the bottom right of your screen. Click on Customization under the Settings section. An edit view of ...Event Report
The Event Report page provides a centralized view for reviewing, investigating, and managing events. It combines device trends, event metadata, assignment controls, and collaboration tools to help users quickly understand what happened and take ...