Event Streaming
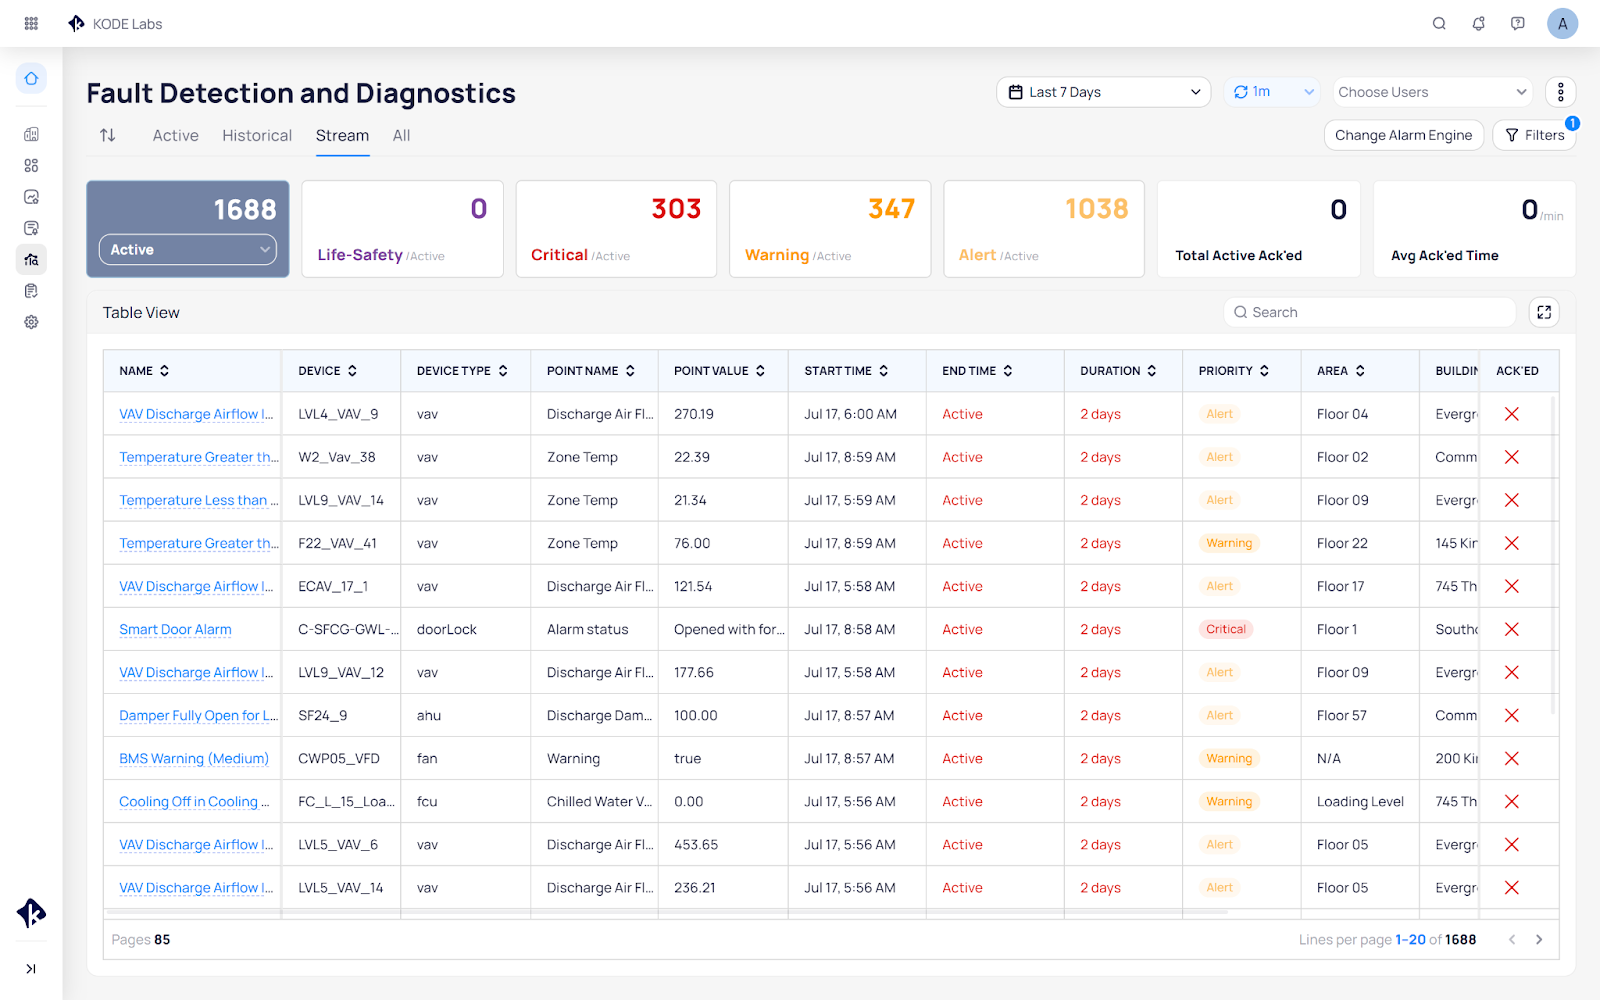
The FDD Streaming View provides the classical interface for monitoring building notifications along with a number of preference settings to adjust the view to needs of the portfolio or user.
Highlights
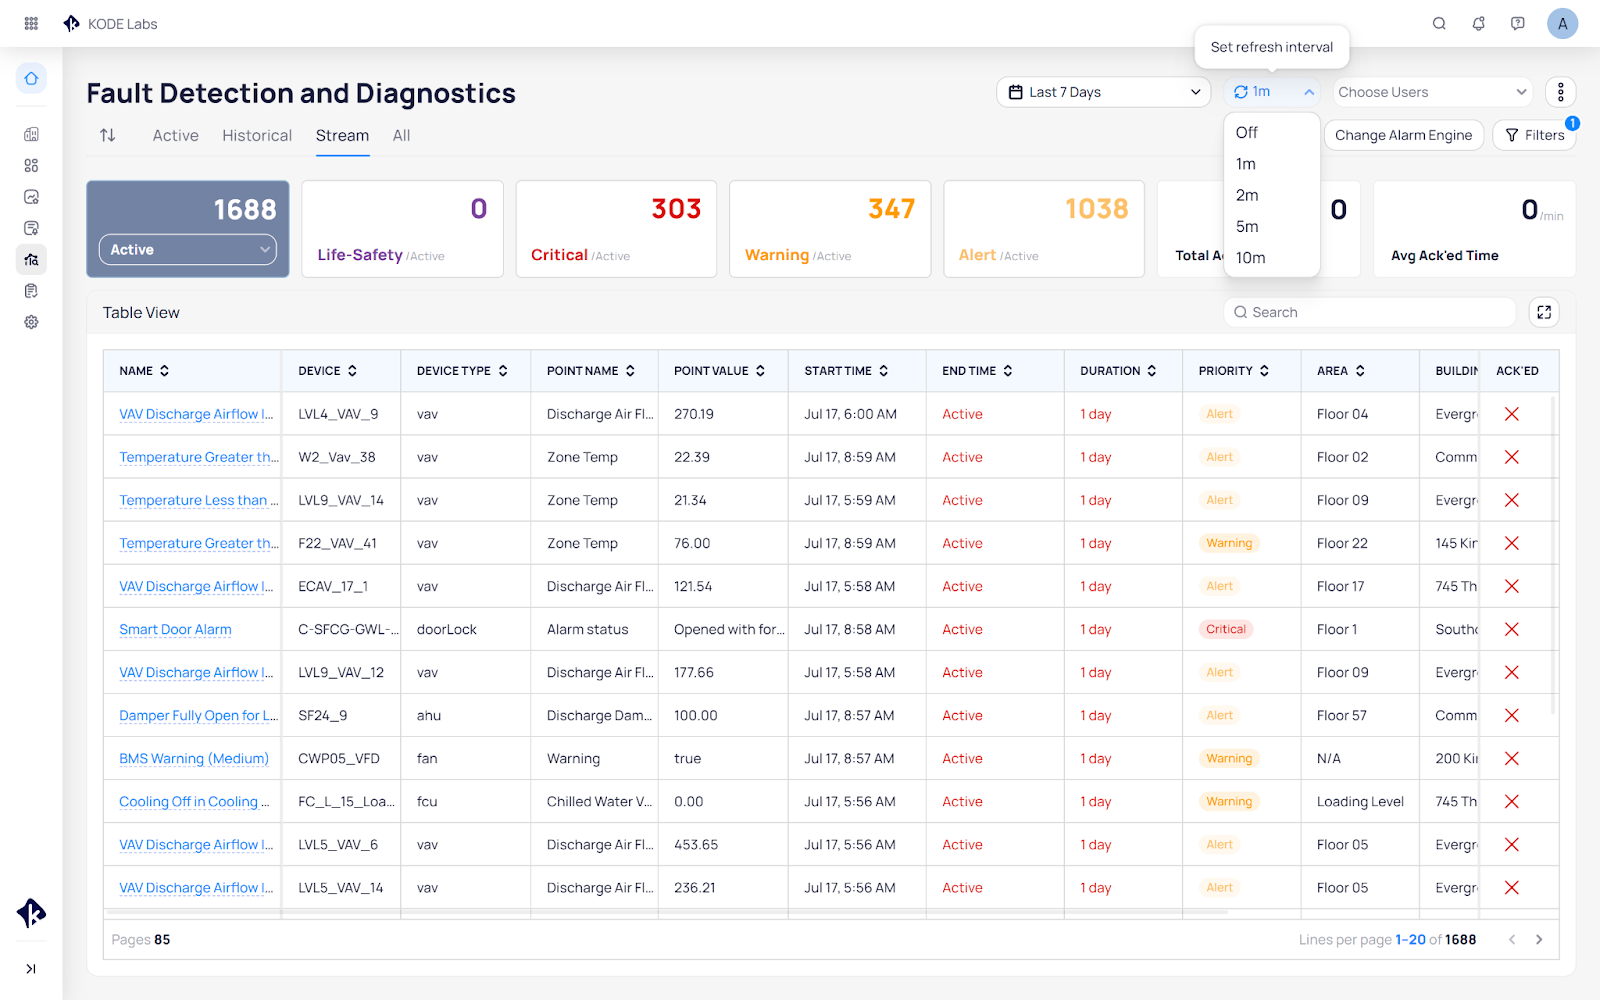
Automatic Refresh
Streaming comes with an option to automatically refresh the table view every 1, 2, 5, or 10 minutes enabling users to keep this screen open at all times.
Simple User Interface
The classical table view provides a simple interface that works for retail sites, small deployments, commercial offices, critical systems like data centers and health care facilities.
User & Portfolio Preferences
The Streaming update includes a number of user and portfolio preferences to optimize the interface including user, building, portfolio filters, status tracking, and customizing the FDD landing page.
Features & Functionality
Event Streaming introduces a number of new functionalities to enhance the user experience with the table view.
Automatic Refresh
Located in the top right section of the page. The user can adjust the refresh rate of the view between off, 1, 2, 5, or 10 minutes.
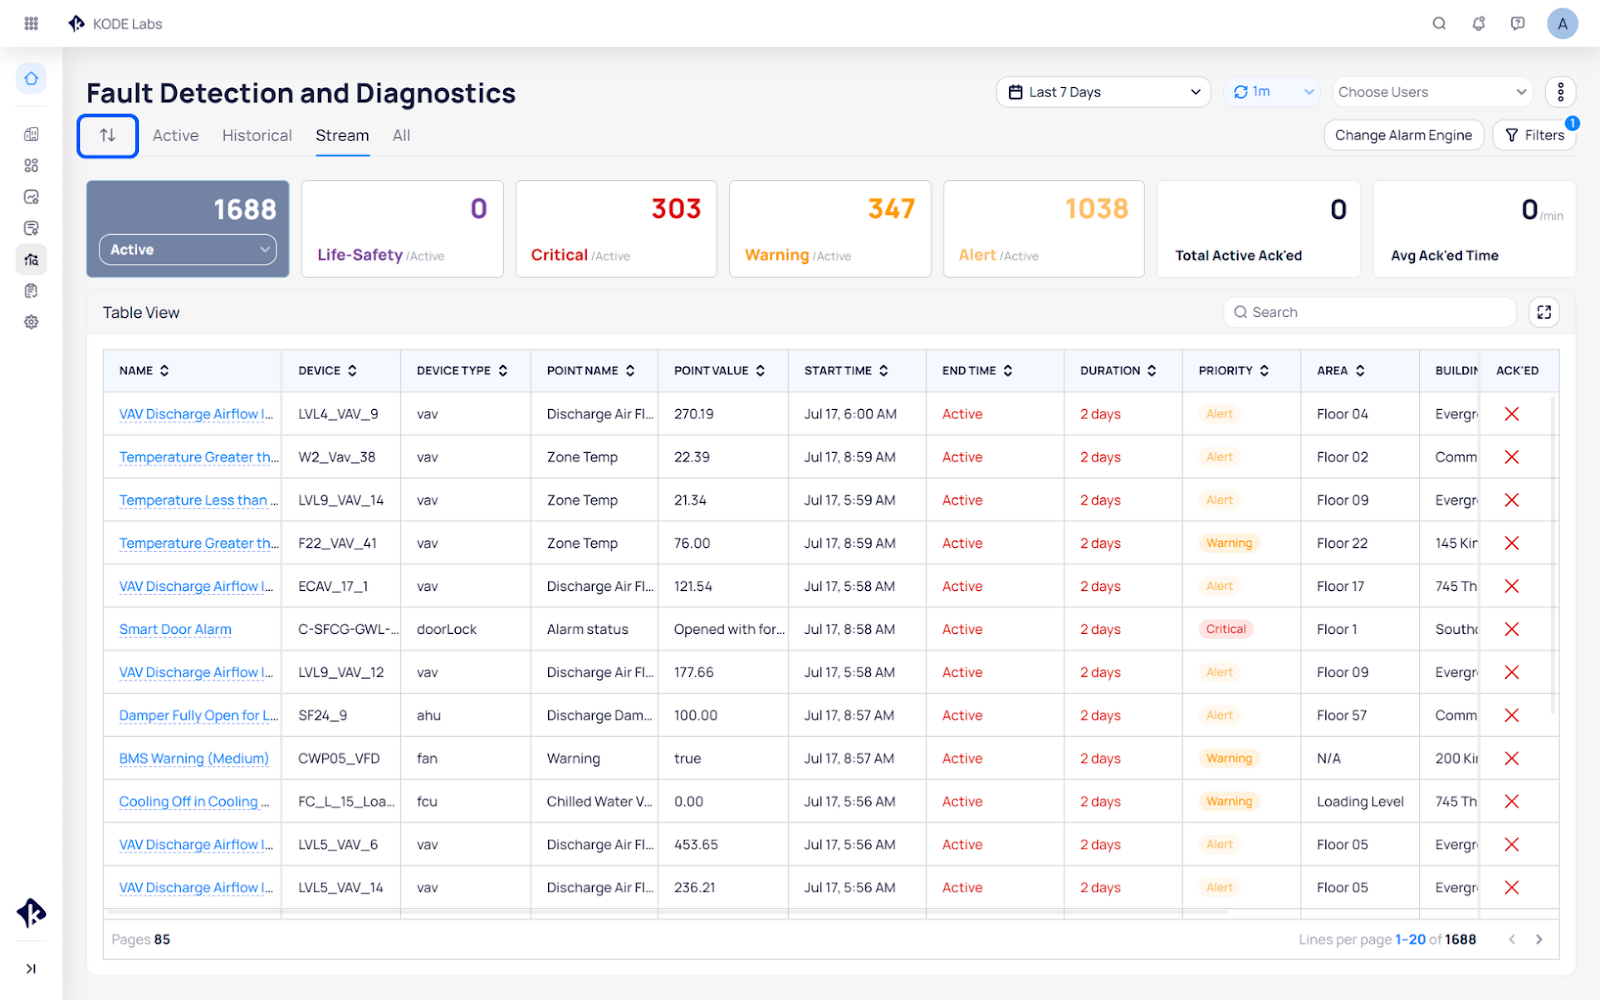
Set User Preference for Page Order
Using the up down arrow directly below the Fault Detection and Diagnostics page header, users can now set their preference for page order, including the ability to set the landing page by choosing which page (Stream, Active, Historical, and All) appears first in the order.
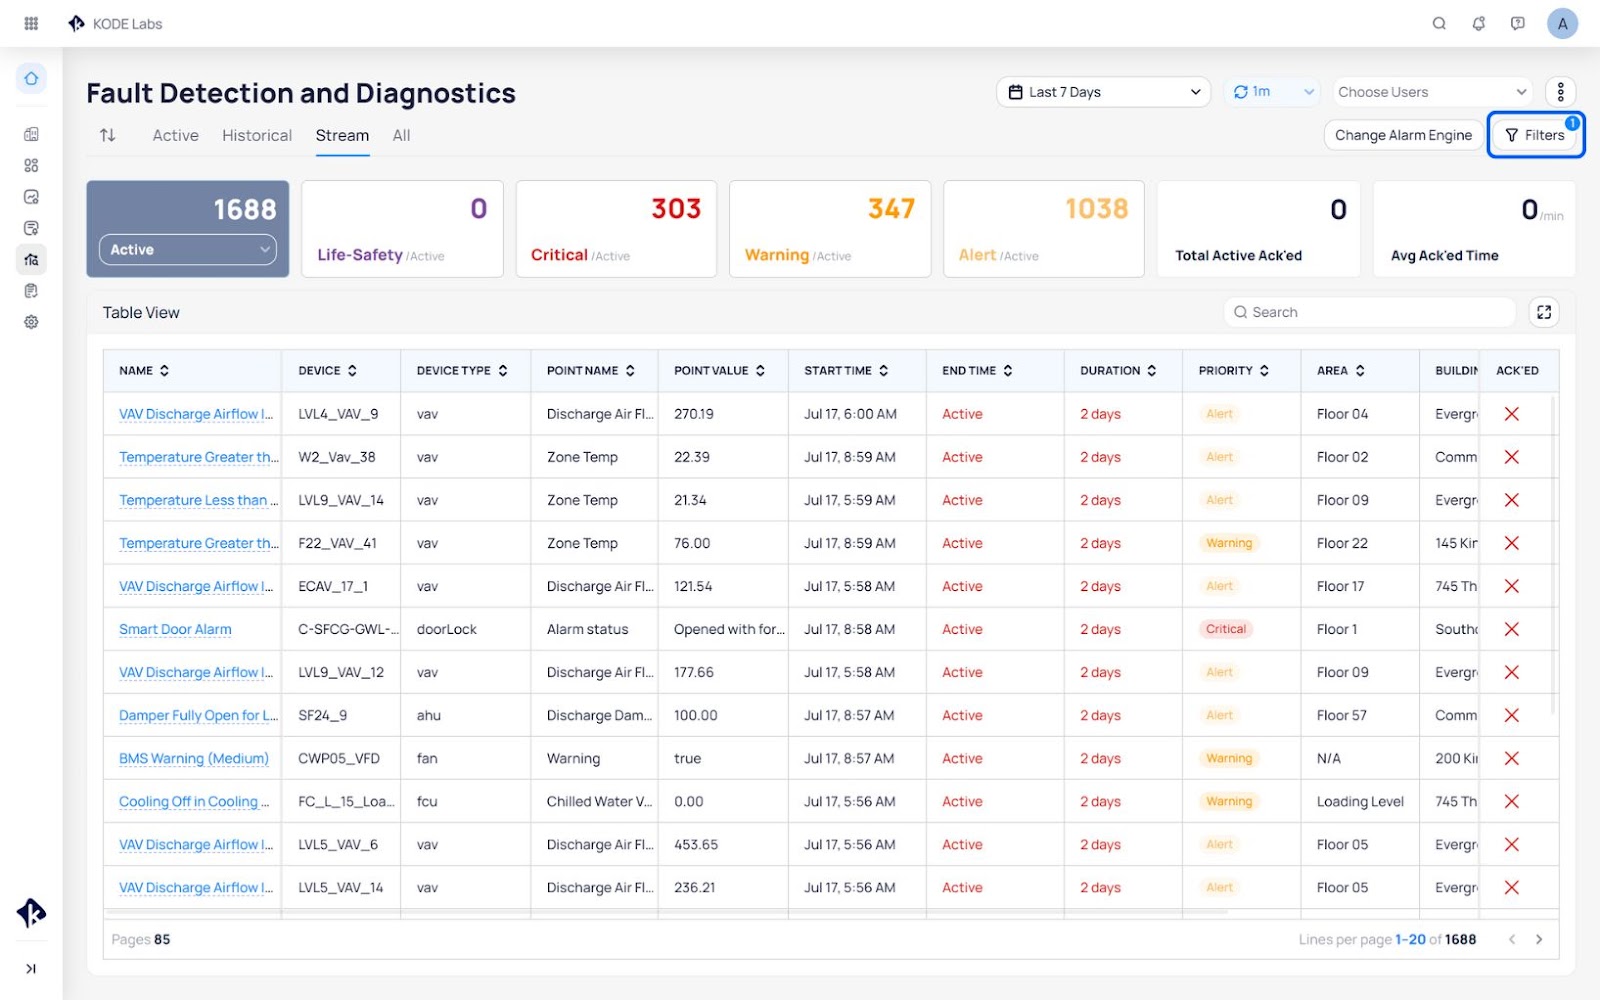
Updated Filtering UI
When clicking the filter button on the right hand side of the page, a series of dropdown filter options will appear for the user to select.
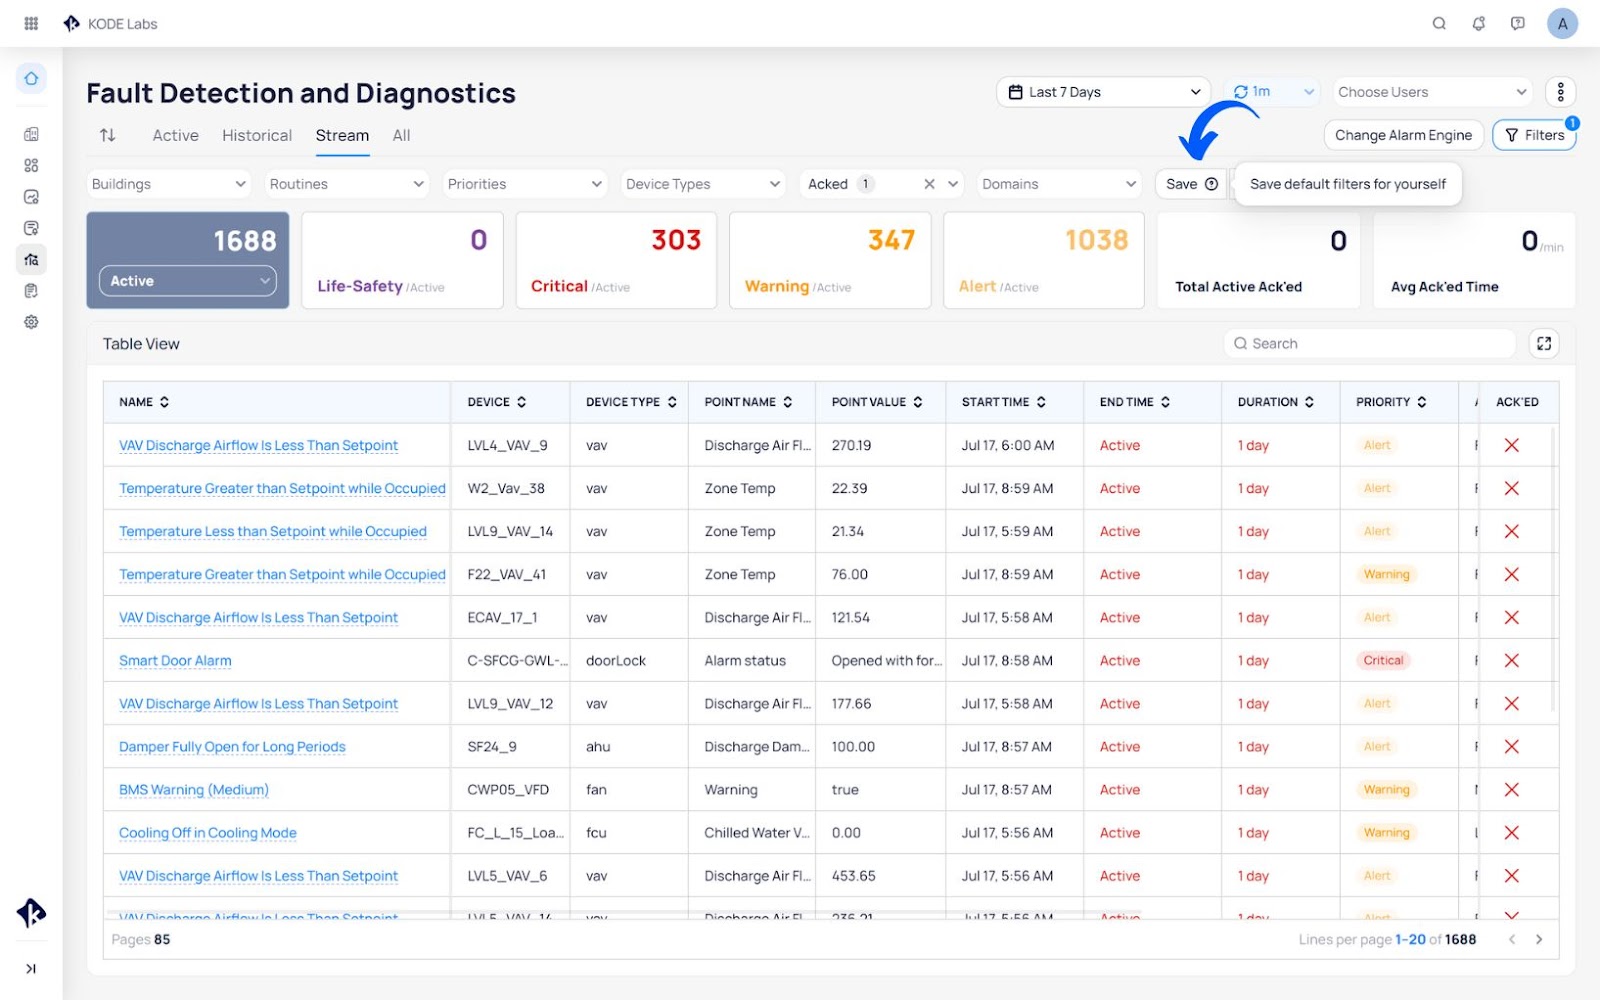
Saving User, Building and Portfolio Filters
Users can now save filter preferences for themselves, the building, or the portfolio view. Simply apply your filters and use the Save button
to save the defaults for yourself, building or portfolio.
User Default Filters
This can be extremely useful when there are multiple user roles monitoring faults in the building such as energy, security, and building operators. Allowing each user to have a customized slice into the faults of interest.
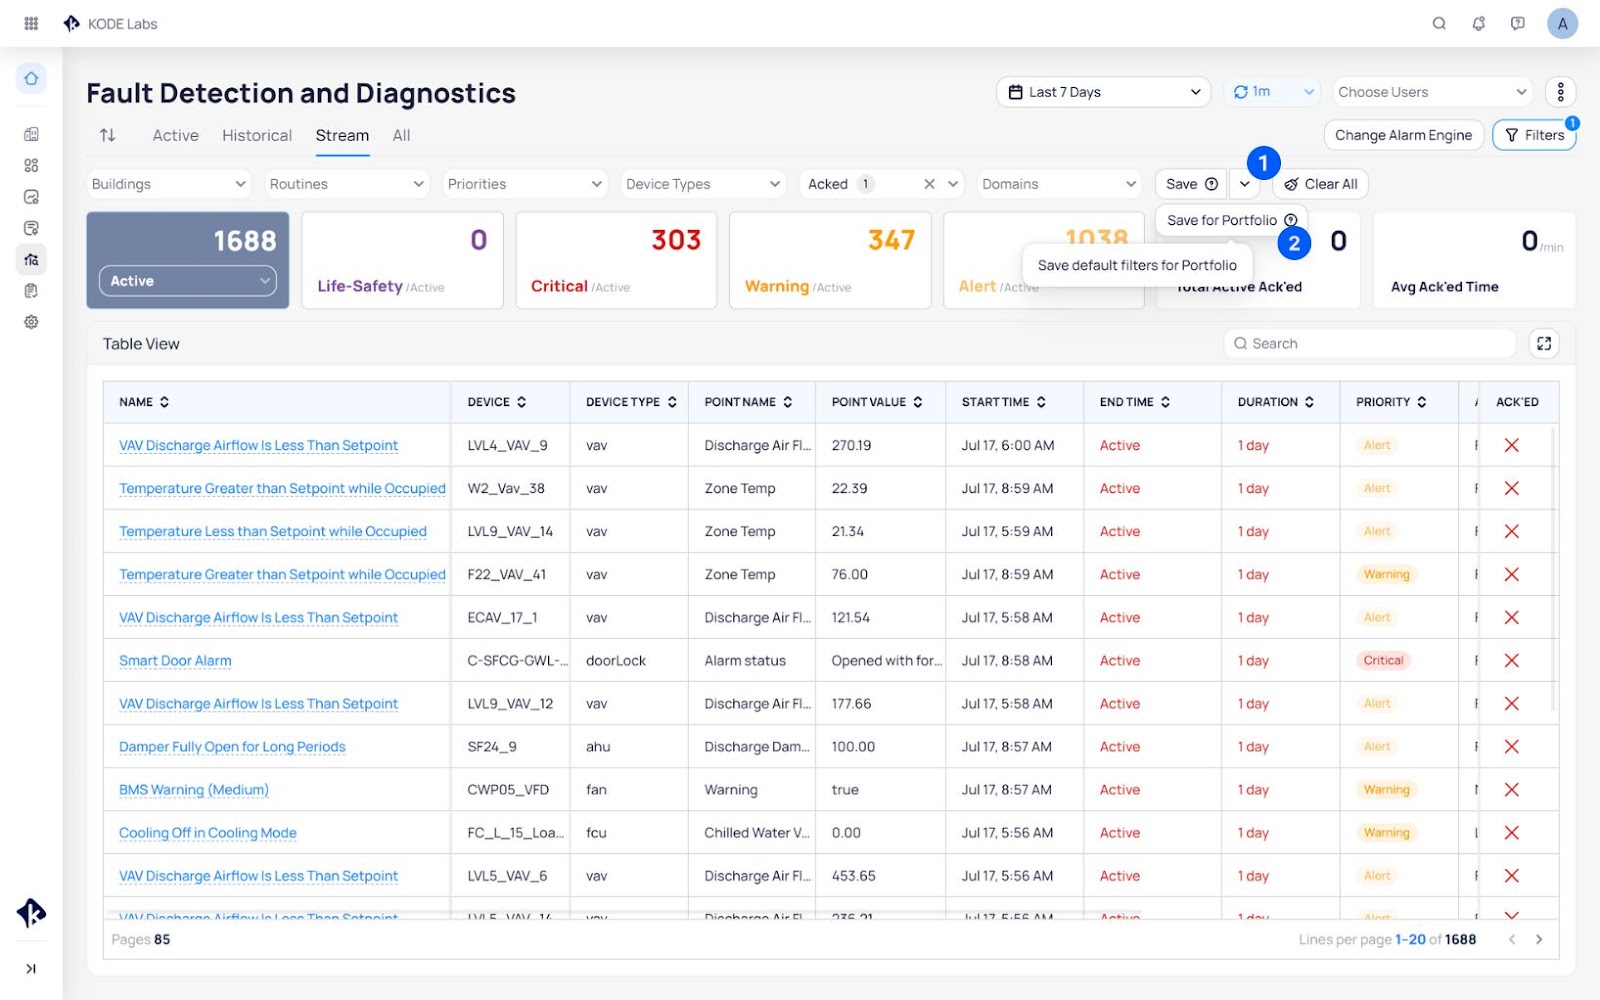
Portfolio Default filters
Portfolio preferences apply ONLY to the Portfolio View of FDD. It does not apply to every building in the portfolio. Similarly, the building preferences do not apply to the portfolio view.
 Notes: The Event Count updates dynamically with the filters you apply. I.e. if you filter for a specific routine the event count across Critical,
 Warning, and Alert will update accordingly. If you apply a priority filter for Critical only, it will display a count of 0 on cards.
Event Status
Streaming introduces Event Status Filter which is available in the dark blue card at the top of the table. We support 3 options for Event Status and each one acts as a filter on the events table.
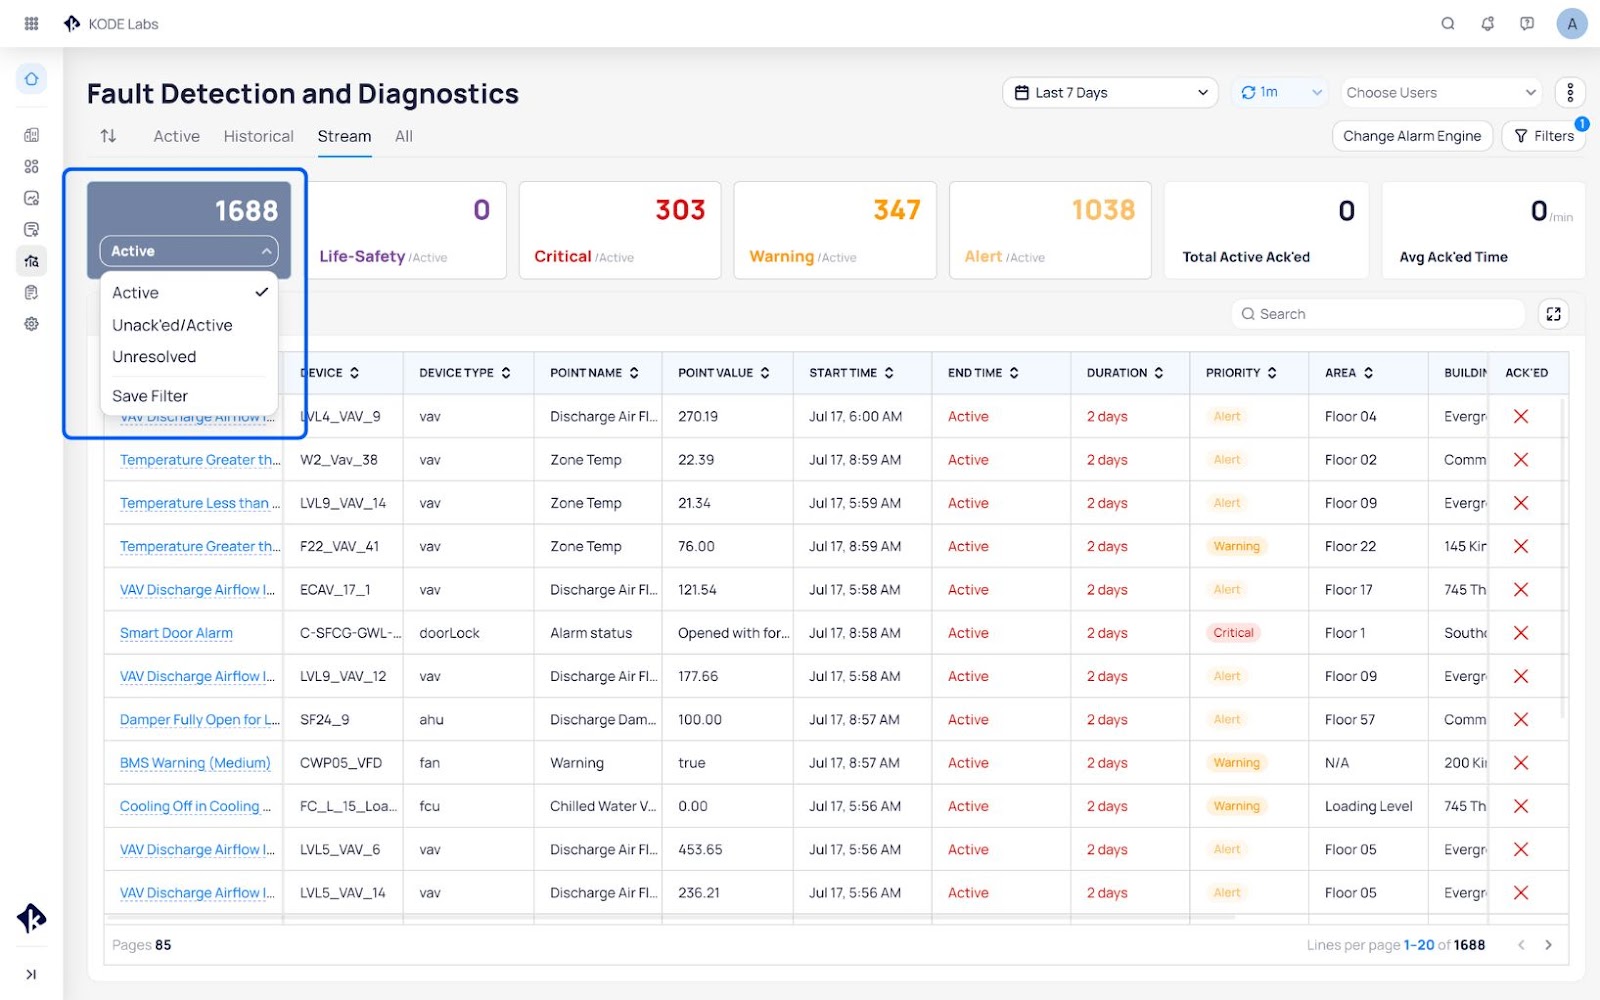
Active - This is the default option. When this filter is selected, the event table will only display active events. If an event goes inactive, it will be removed from the page on the next refresh. This event is removed even if it’s not been acknowledged.
Unacked / Active - This filter will display events that are Active and Unacknowledged. This filter is for users who want to see events streaming in the portfolio, but if they acknowledge them, remove them from the list. If they close by themselves, remove automatically.
Unresolved - In order to “resolve” an event, it must be both Inactive and Acknowledged by a user. This filter will show all events that fail to meet both criteria enabling teams who want to ensure no issue is missed.
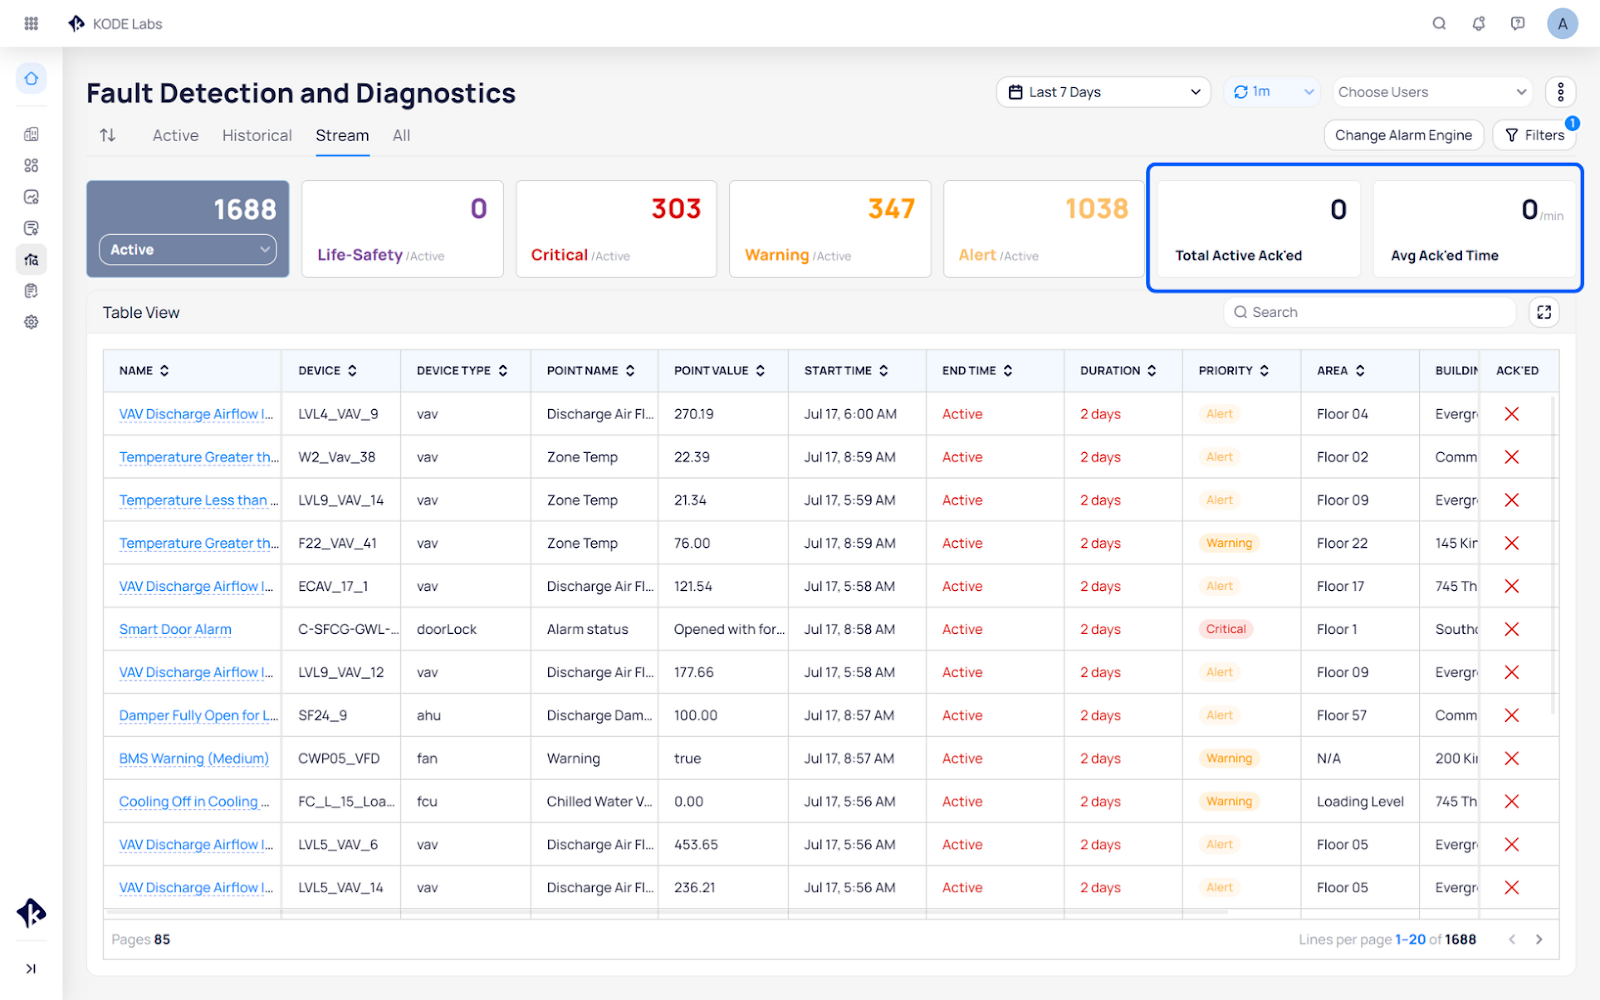
Stat Cards
We’ve introduced two statistics cards on the top of the table view to provide users with insights into their activity & usage of FDD Stream.
Note that these stats are personalized per building & filters.
Total Active Ack’ed - This stat will tell you the total number of events you have ack’ed.
Avg Ack’ed Time - This stat will tell you the average number of minutes it took from an event going active to the time in which it was acknowledged.
Clickable Priority Cards
The priority cards are now clickable and can be applied as filters to the Stream. Clicking these cards will automatically update the content of the
filter drop down and they can be used interchangeably.
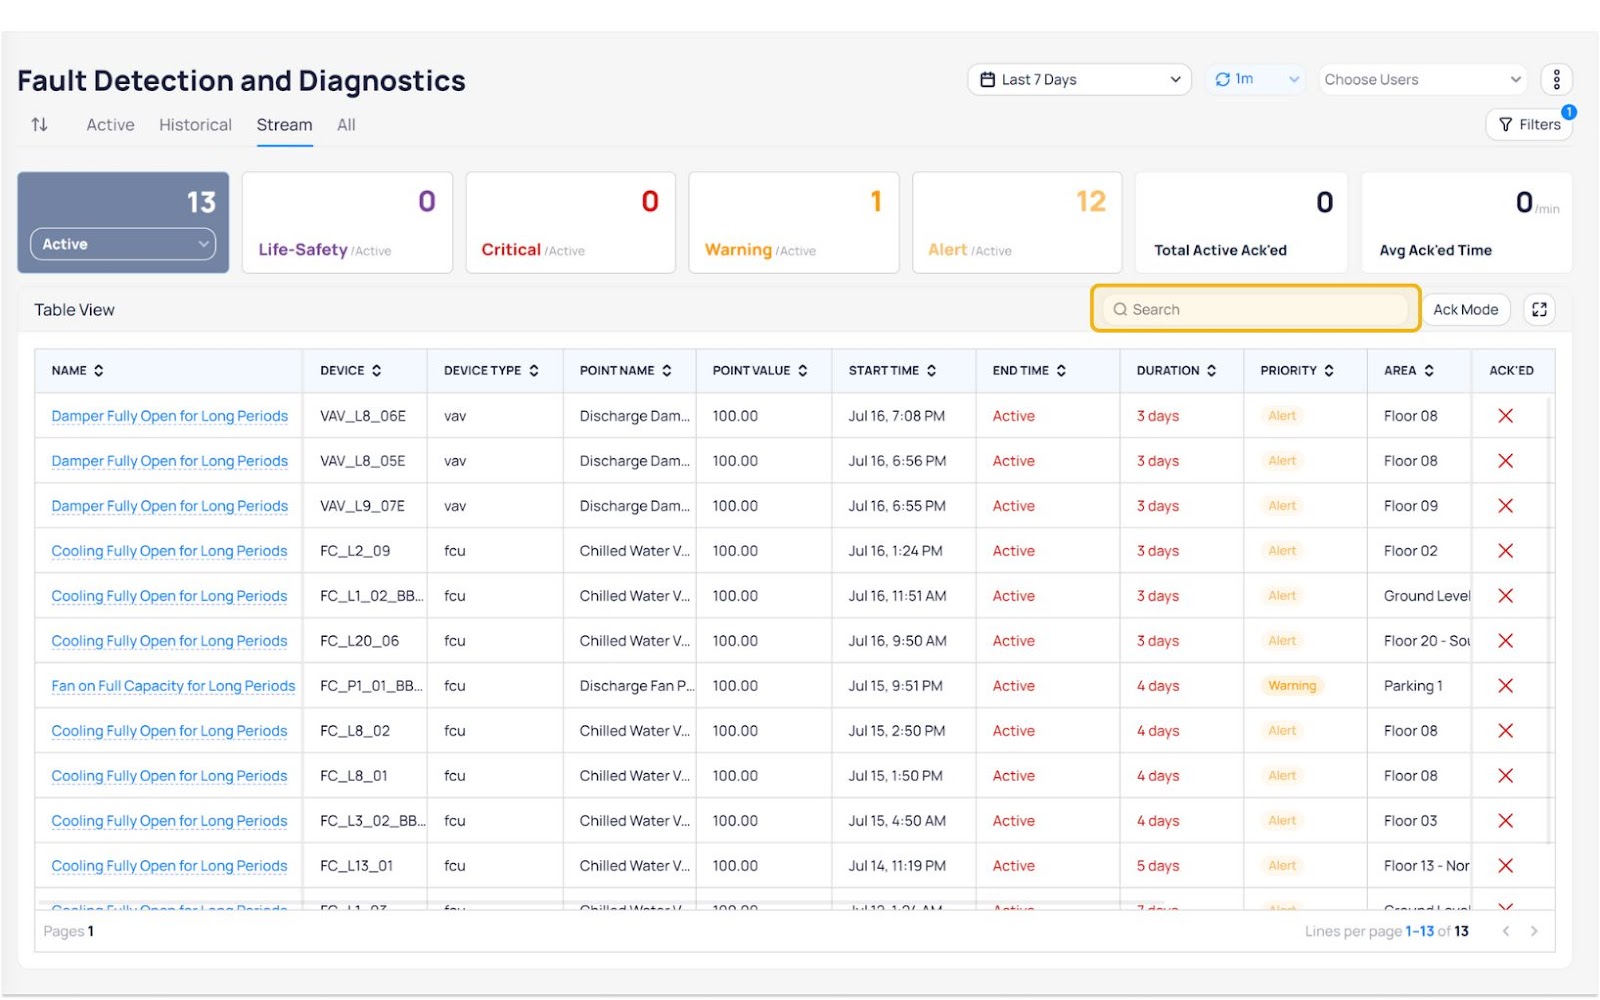
Improved Search
Users can search the event stream by Event Name, Device Name, Building Name.
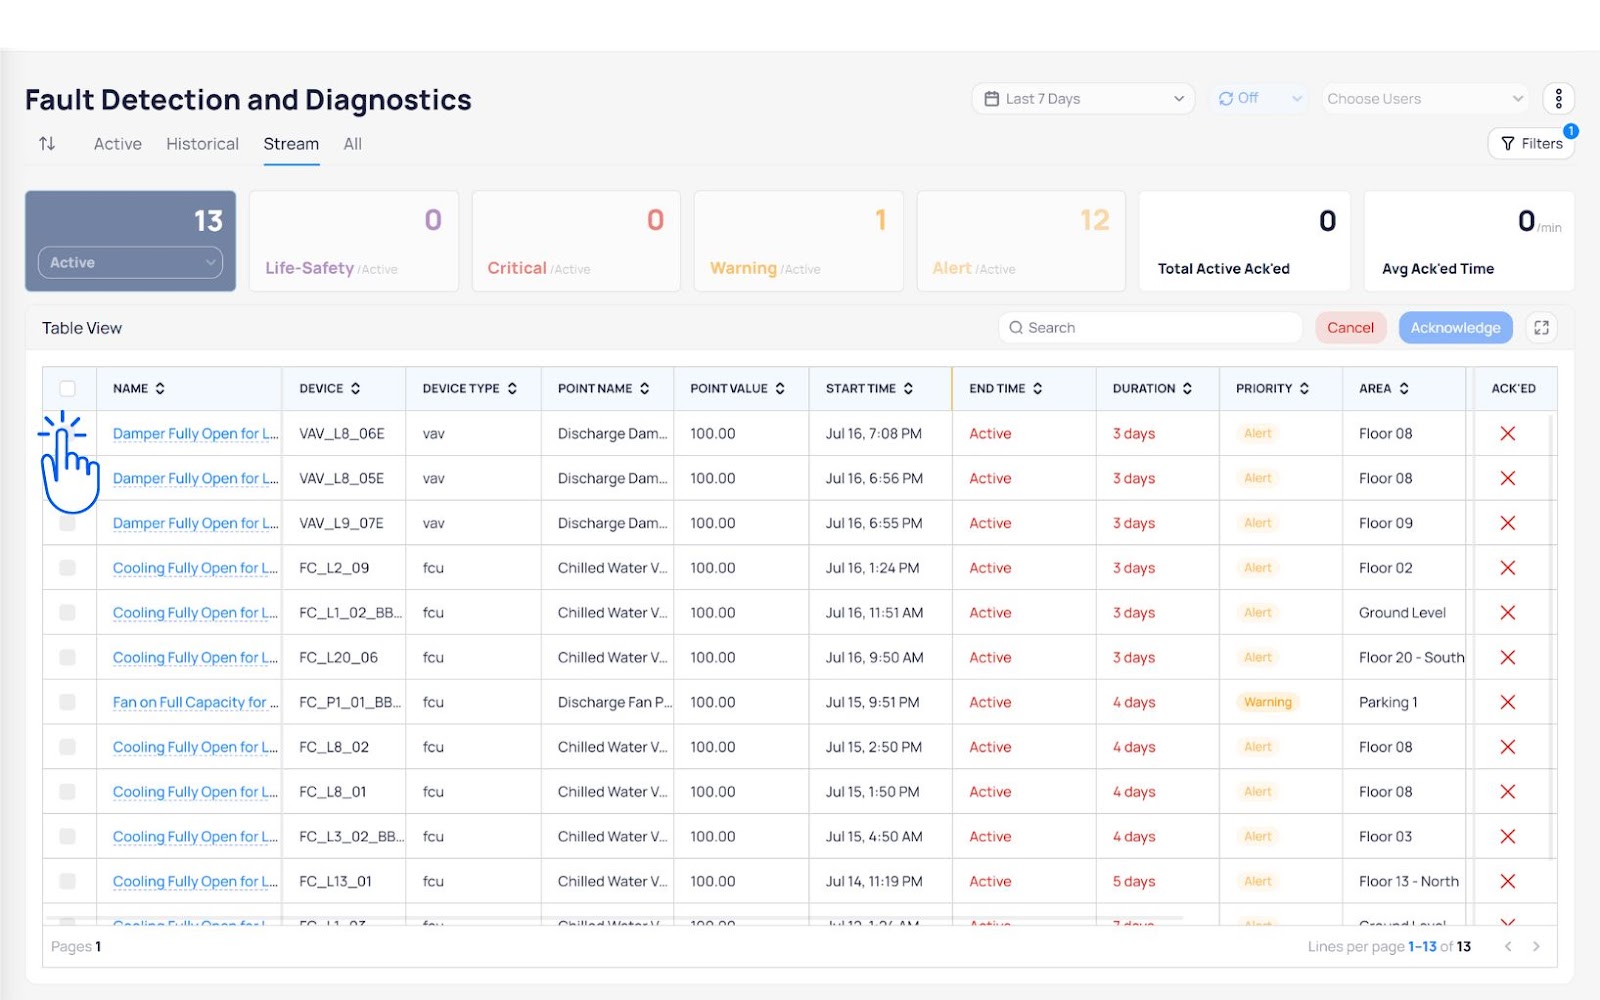
Bulk Acknowledge
Users can now bulk acknowledge Events. Simply click the Ack Mode button and multi-select the events you want to acknowledge.
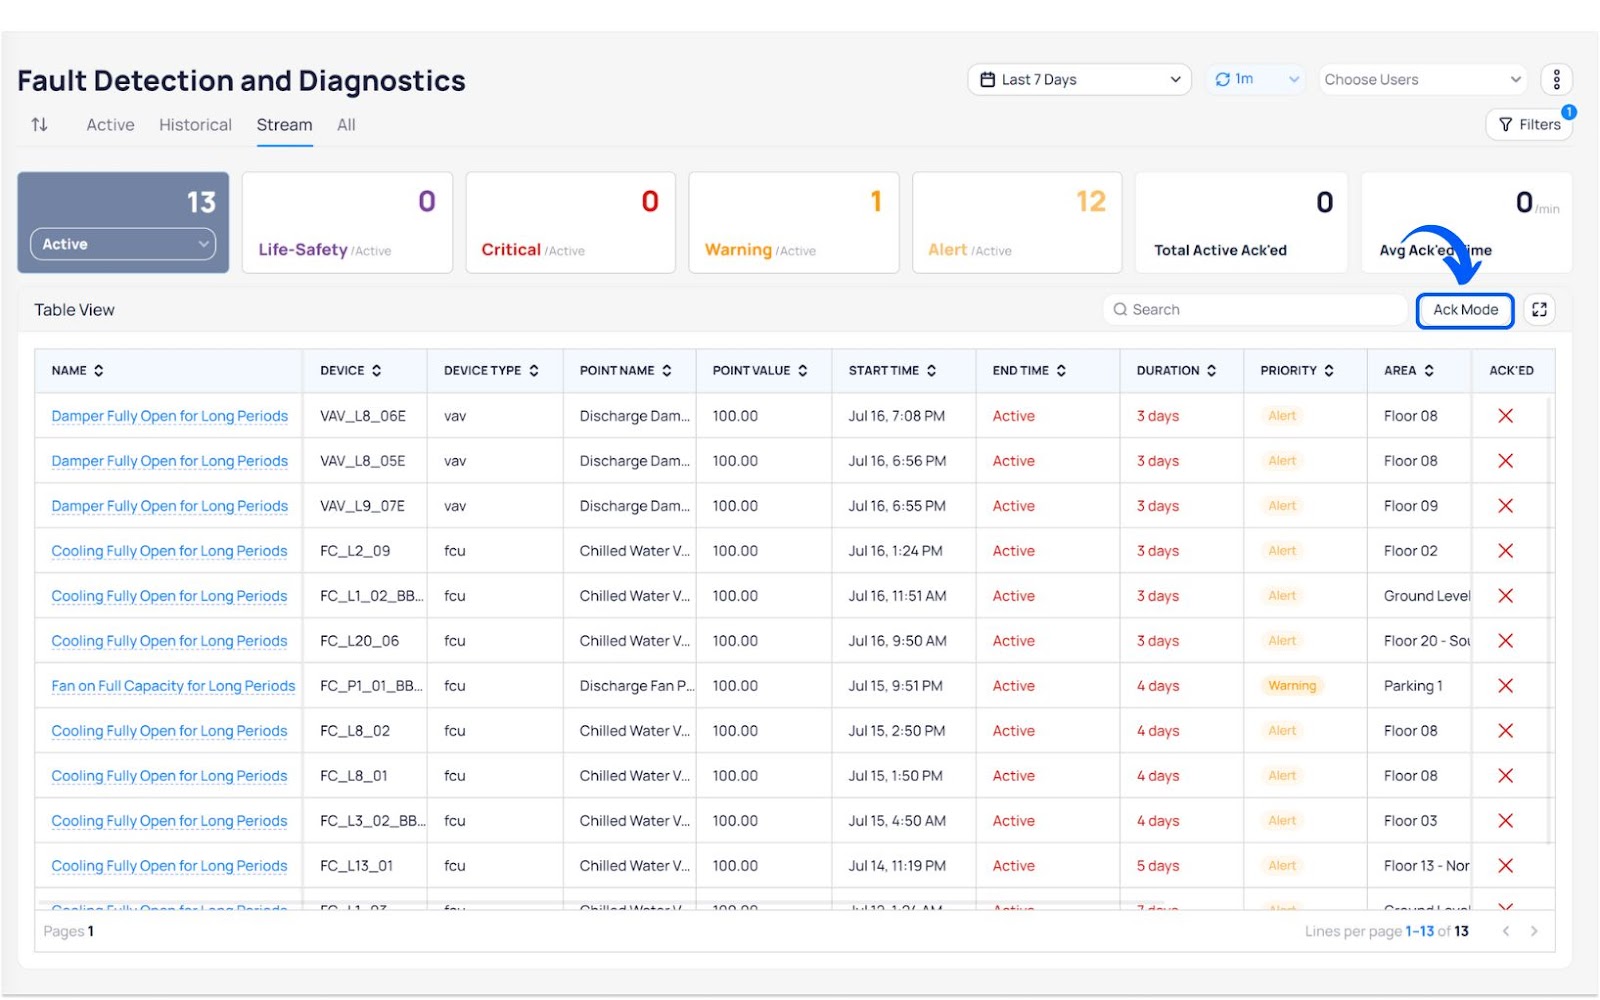
You can multi-select, by using the select all button at the top of the page or by using shift-click to select a range of events.
Full Screen
Last, but not least, we have added a full screen mode if you would like to maximize the list view to be the entire window.
To go into full screen mode, click on the button on the upper right corner.
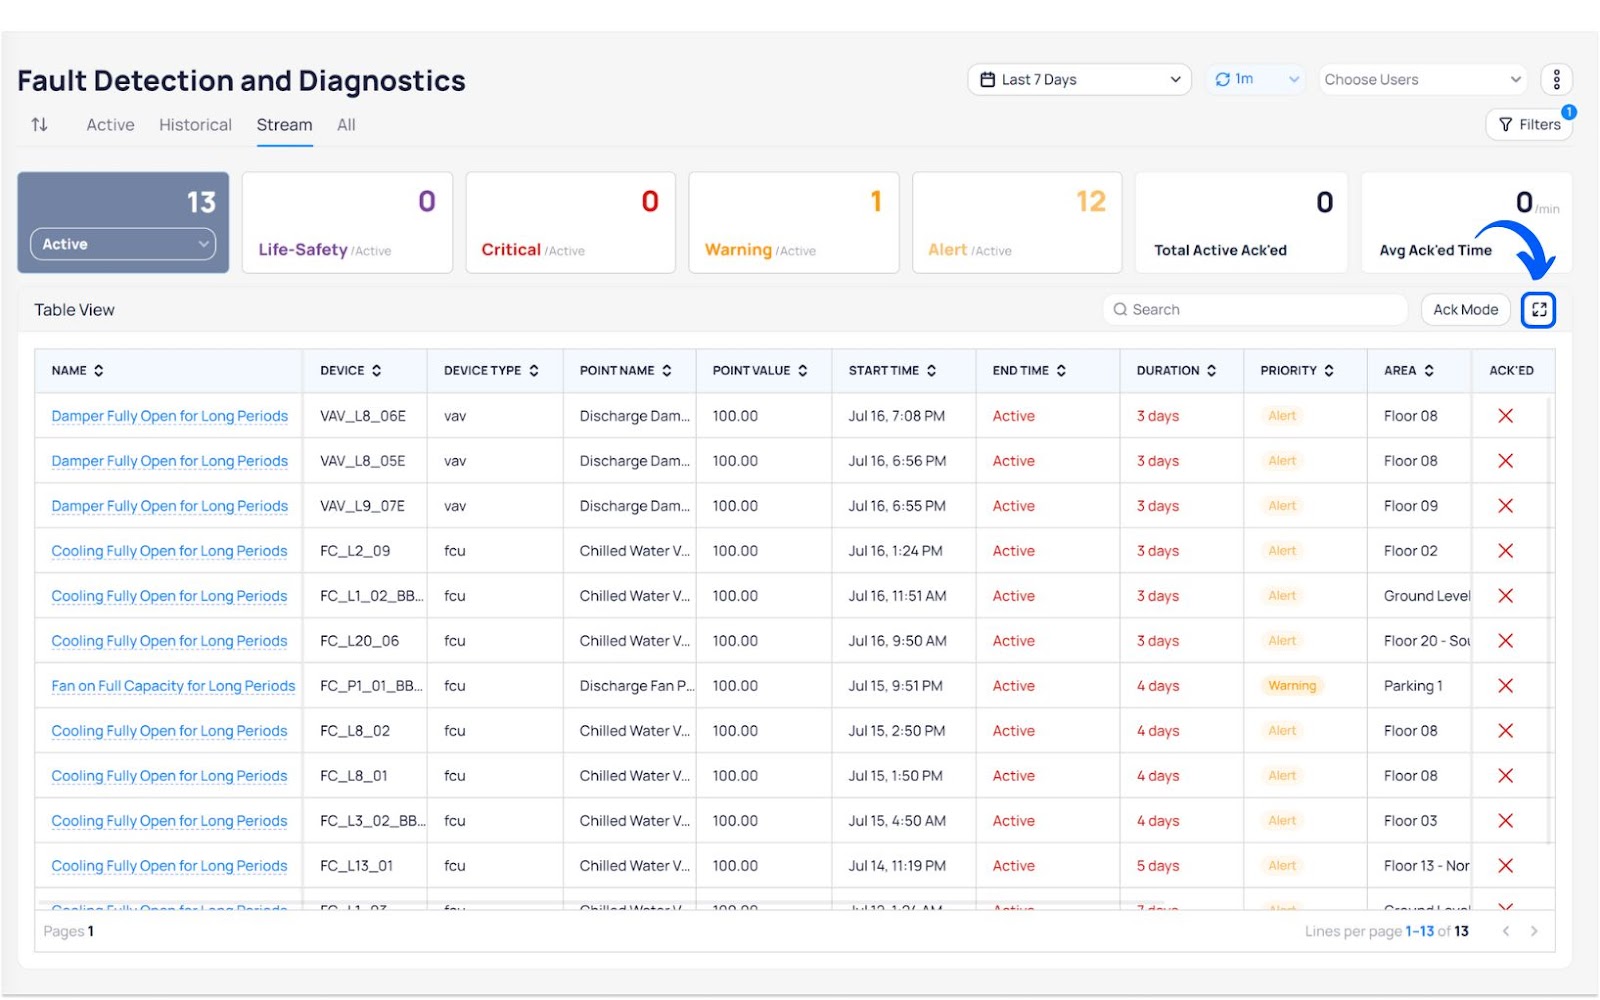
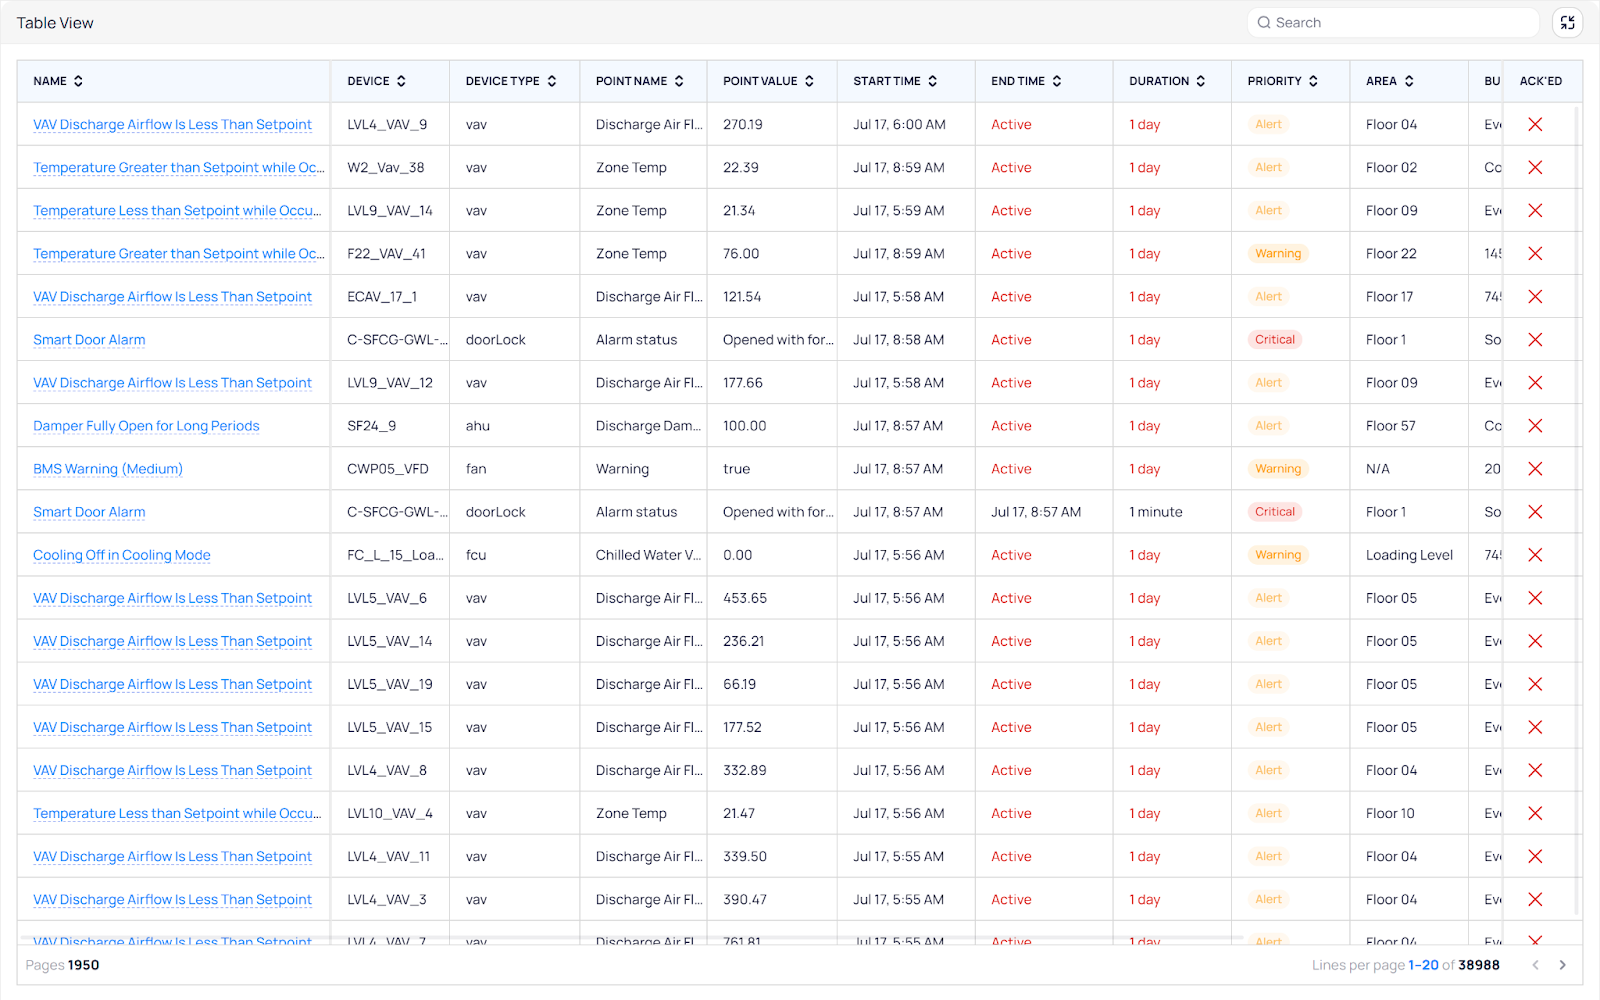
Table View
Related Articles
What is FDD?
Understanding Fault Detection & Diagnostics What is a Fault? A fault is a period of time in which a specified condition is true on a specific device. For example, this is a fault: @8:00am AHU-1 Could not maintain discharge temperature within setpoint ...FDD Dashboard
Fault Detection and Diagnostics (FDD) is a proactive process that identifies and analyzes system failures or faults within a building's infrastructure at their earliest stages. By detecting these faults early on, FDD enhances system performance, ...Event Library
KODE OS automatically monitors the operation of your equipment and will raise a user’s awareness whenever event threshold conditions are met. Out of the box, KODE OS supports an event library that can be deployed to monitor HVAC, Fire, ...Event Configuration
The goal of event configuration is to establish monitoring and alarming on any of the newly integrated pieces of equipment. Follow the below steps to configure events of your choice. 1. Navigate to the Events icon through the left navigation bar. 2. ...Using the Event Dashboard
KODE OS monitors the operational health of your equipment 24/7 via event routines which cover everything from fan command failures to zone temperature off setpoints. Through the Events Dashboard in KODE OS you can view all active and historical ...