Device Connectivity Report
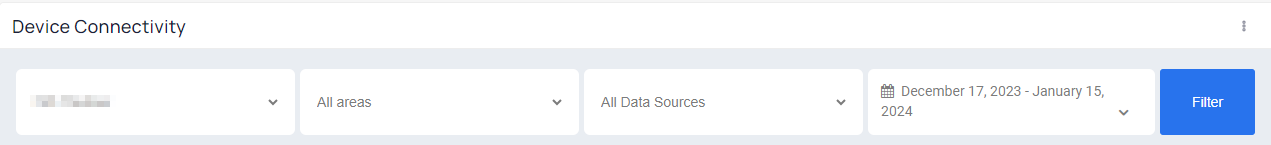
The Device Connectivity Report provides a comprehensive overview of data sources and the uptime and downtime status of devices at a portfolio level. This report enables you to filter information based on individual buildings, areas, and data sources. Additionally, it allows you to track changes over time, providing flexibility in monitoring and analyzing device connectivity trends.
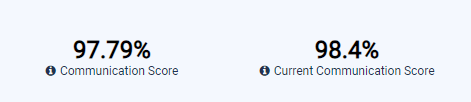
The central component of the Device Connectivity Report is its main widget, which presents the Communication Score of devices based on the chosen time frame, building, area, and/or data source. Furthermore, this widget provides insight into the Current Communication Score specific to the selected building, area, and data source.
Data Source Network Health
The Data Source Network Health chart visually represents the uptime and downtime percentages of data sources, gathering data based on the selected time period, building, and/or data source.
Up - The percentage for the amount of time the data source was up during the selected time period for the selected building or portfolio vise.
Down - The percentage for the amount of time the data source was down during the selected time period for the selected building or portfolio vise.

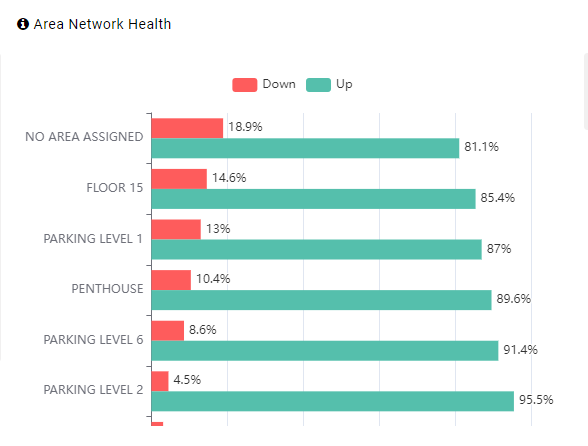
Area Network Health
The Area Network Health chart illustrates the percentage of device uptime and downtime, offering insights on a per-building basis when viewing data at the portfolio level and per-area basis when examining data at a building level. This chart allows for additional filtration based on the selected time period, building, area, and chosen data source, providing a comprehensive analysis of device performance metrics.
Data Source/Area Network Health
The DataSource/Building Network Health table presents the average daily percentage of device downtime over the selected time frame. This average is calculated based on the number of devices within a building originating from the chosen data source. The table's data is displayed at the portfolio level, with the option to apply additional filters based on the selected time period and data source. This provides a detailed overview of device performance metrics within specific buildings and data sources across the portfolio.
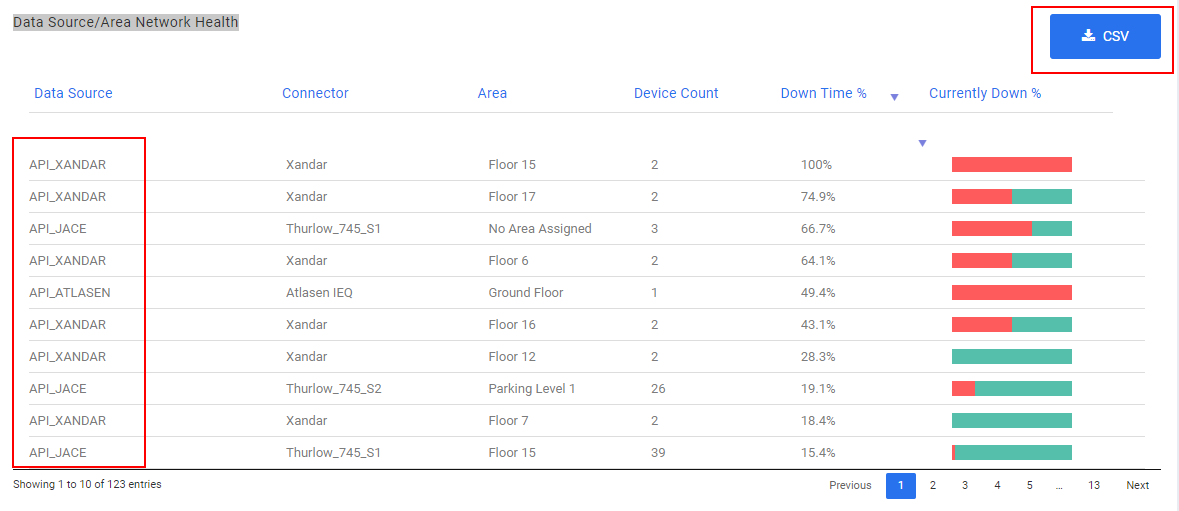
The table is exportable as well. Clicking on the CSV button at the top right, all available data from the table will be exported in a CSV format.
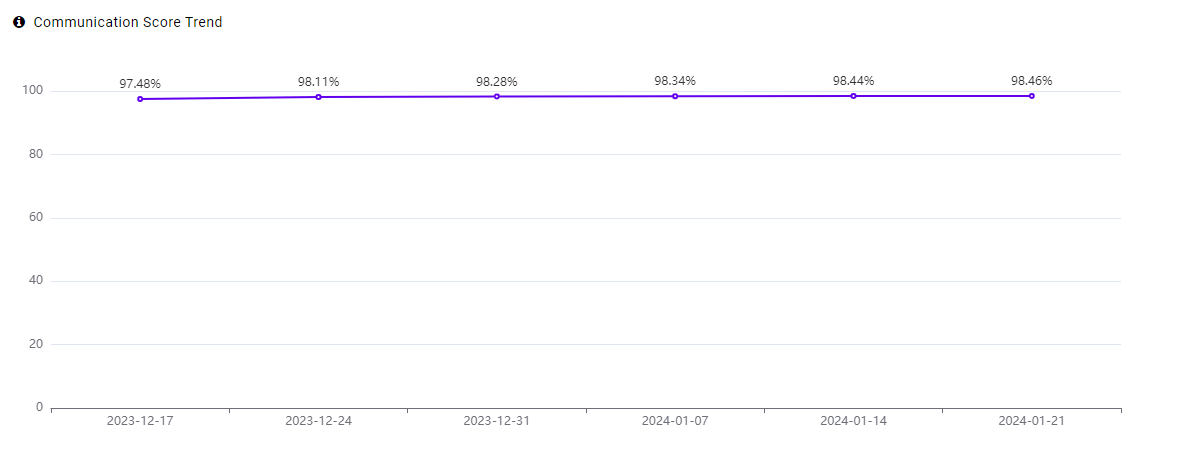
Communication Score Trend
The Communication Score Trend is a chart showing the average daily percentage of datasources connection time during the selected timeframe. Data from this table can be shown on a portfolio level, but also they can be further filtered based on individual buildings, the time period, area and data source.
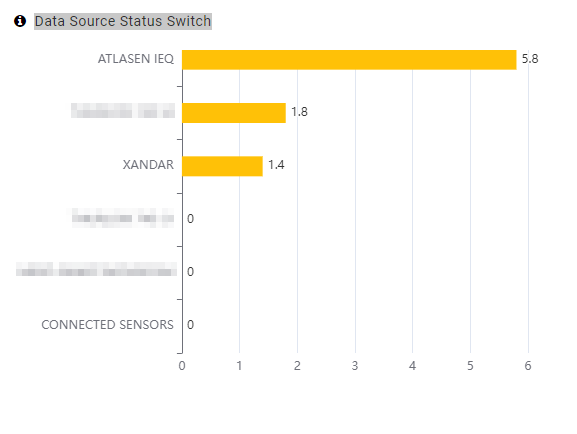
Data Source Status Switch
The Average DataSource Status Switch is a chart showing the average daily status switch of a data source during the selected timeframe. Data can be further filtered based on the time period, building and/or area and data source.
Device Type Network Health
The Device Type Network Health is a chart showing the average daily percentage of each device type downtime during the selected timeframe. Data can be further filtered based on the time period, building and/or area and data source.

Data Source/Area/Device Network Health
The DataSource/Area/Device Network Health is a table that shows
The average daily percentage of a device downtime during the selected timeframe
The average daily duration of a device downtime during the selected timeframe presented in hours
The daily status switch of a device during the selected timeframe
Current device status
Data from this table are shown on a building level and can be further filtered based on the time period, area and data source chosen.

The table is exportable as well. Clicking on the CSV button at the top right, all available data from the table will be exported in a CSV format.
What are common causes for down devices?
Network issue
Poor RS485 BACnet MSTP installation
Failed controller (local device)
Related Articles
Adding a new Data Source
To enable the device discovery in KODE OS, it's essential to add a data source to import the necessary data. Follow the steps below for instructions on how to proceed: 1. Click on the site of your choice. 2. Navigate through the options on the left ...Discovering Devices
The goal of device discovery is to identify the equipment that has been integrated into a Data Source and to bring that data into KODE OS. Follow the below steps to help you discover your devices. Navigate to a building of your choice through the ...Device Referencing
In Building Management Systems, referencing is vital for creating a digital twin, a virtual model that mirrors real-world device connections. This helps diagnose issues, run functional tests, and ensure efficient building operations. Building devices ...Device Graphic
Device Graphic is a powerful tool for visualizing your building's HVAC system in real time. It allows you to monitor and control your AHU, VAV, and HVAC devices and their components, all from a single interface. Overall, Device Graphic is an ...Integration Log
The Integration Log report is a snapshot of the deployment status on a building basis which gives you an easy to follow user-experience providing all configuration/integration features in one place and showing what is done and remains to unlock the ...