Device Graphic
Device Graphic is a powerful tool for visualizing your building's HVAC system in real time. It allows you to monitor and control your AHU, VAV, and HVAC devices and their components, all from a single interface.
Overall, Device Graphic is an essential tool for building management professionals who want to keep a close eye on their HVAC systems. With its intuitive interface and powerful features, it is the perfect solution for anyone looking to improve the performance and efficiency of their building's HVAC system.
Navigate to Device Graphic
To get started simply navigate to device details. You can get to the device details in a few ways:
Via the Site Homepage > Devices > search and select the desired Device from the device list.
When you search for a device by name and select it, you will be taken directly to its Device Details page.
The search function can be accessed by clicking on the search icon in the main navigation bar on the left.
Via the Site Dashboard > Areas > Select a Floor > from the floor plan graphic click on Device Name (the same can also be achieved via system graphic).
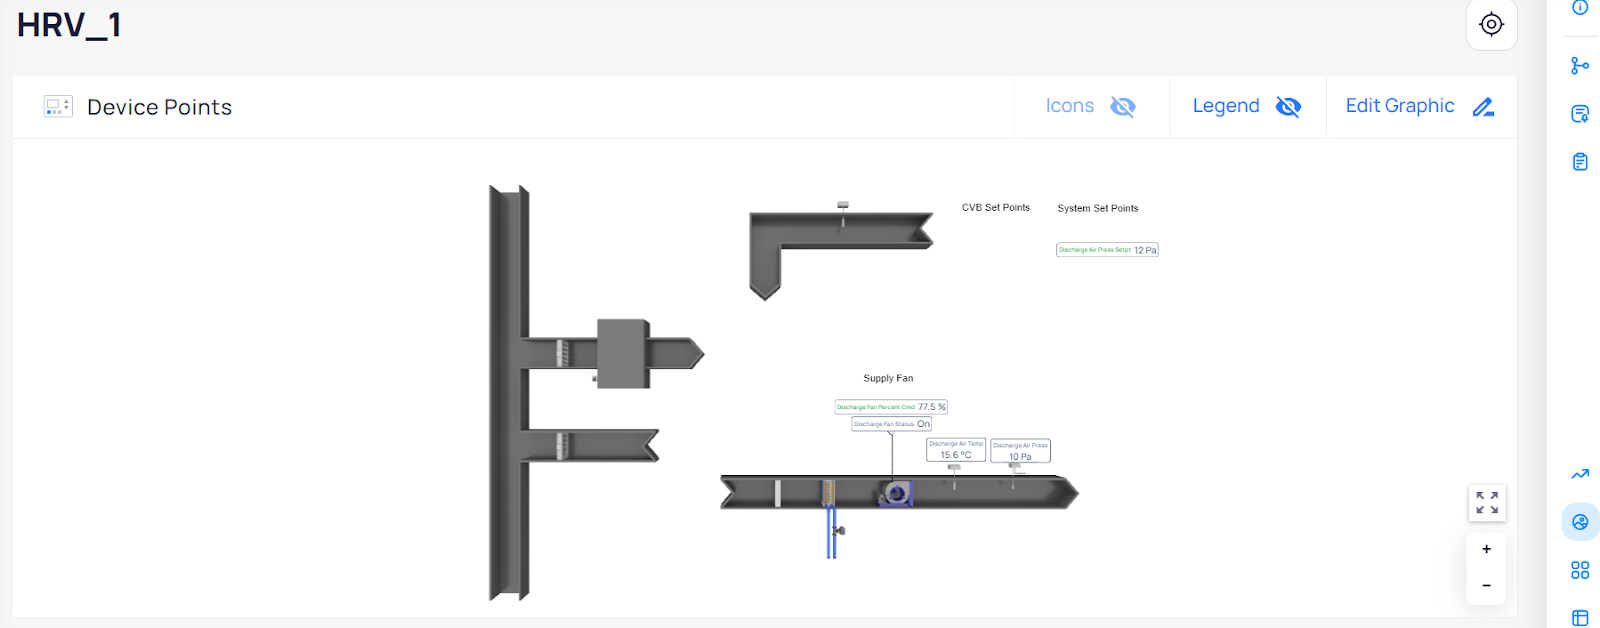
To access the Device Graphic View, click on the Graphics icon at the bottom of the right sidebar. Here, you will see a graphical representation of your building's HVAC system, with each device and component represented by a distinct icon.
Review and Monitor points from Device Graphic
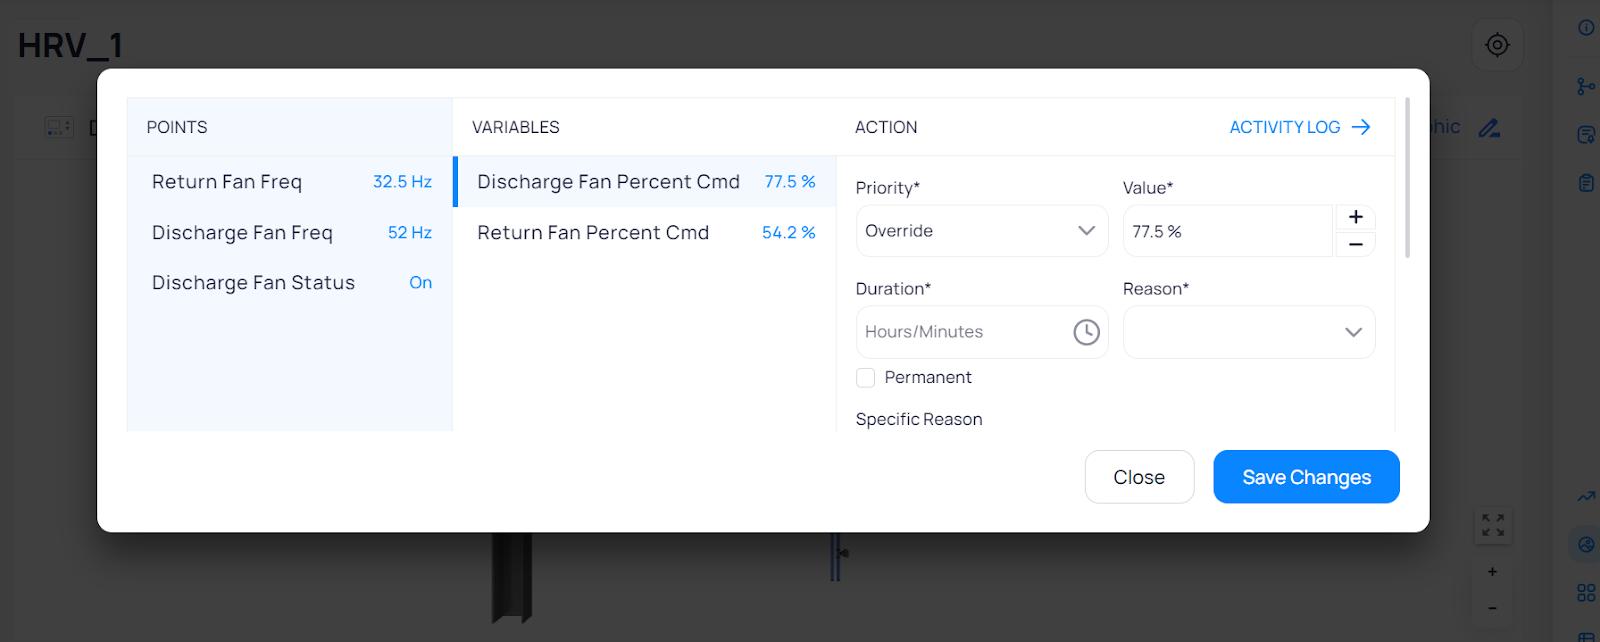
In addition to monitoring your devices, you can also use Device Graphic to control them. Simply click on the relevant icon to bring up the control panel, where you can adjust settings such as temperature, fan speed, and more.
To review and monitor AHU, VAV, and HVAC devices performance from Device Graphic tool, follow these steps:
Log in to your account and navigate to the Device Graphic dashboard.
Look for the AHU, VAV, and HVAC devices on the graphical representation of your building's HVAC system.
Review the device's current status, temperature, pressure, and other important metrics to get a sense of its performance.
Use the historical data and trend analysis features to track performance over time and identify any issues or inefficiencies.
Set up alerts and notifications to be notified of any significant changes in performance, so you can quickly address any problems.
Use the control panel to adjust settings and optimize performance if necessary.
Configure Device Graphic
Upload Device Graphic
By uploading a Device Graphic, you can create a custom visualization of your building's HVAC system that is unique to your needs. This will make it easier to monitor and control your system in real time, improving its performance and efficiency.
To upload Device Graphic, follow these steps:
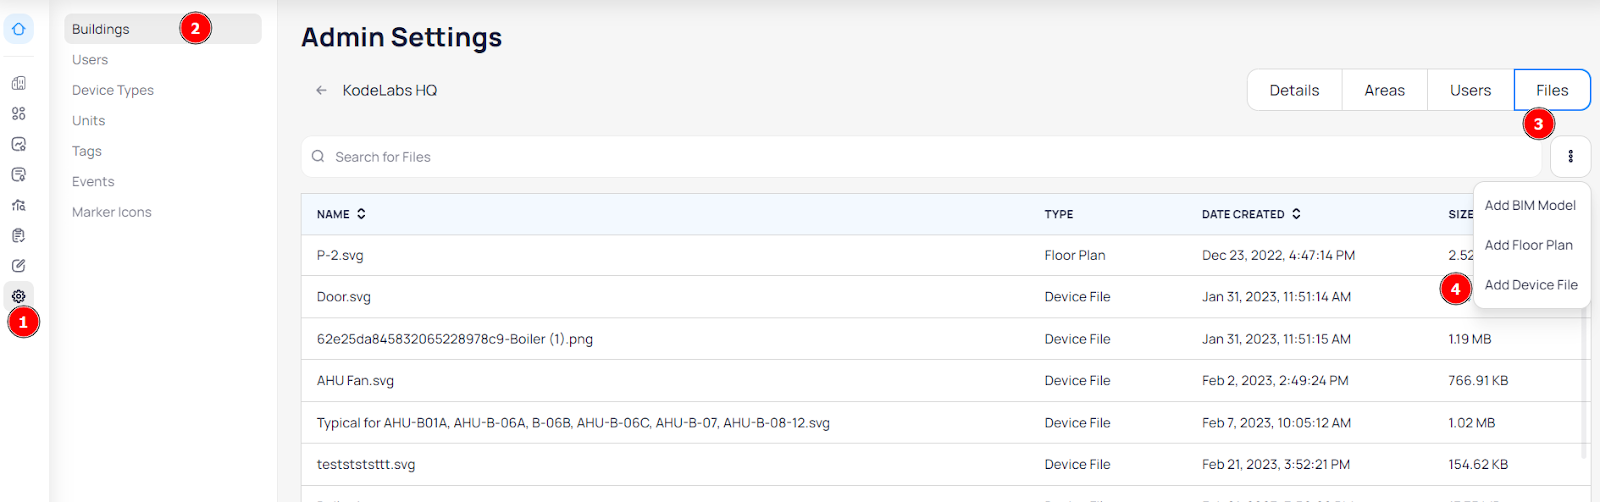
Navigate to the Admin module from the left main navigation bar > Buildings > choose a building > Files.
Click on the three dots at the top right of the Files page > from the dropdown menu select + Add Device File.
Select the file you want to upload from your computer. The file should be in a compatible format, such as a PNG, JPEG, or SVG.
Wait for the file to upload. This may take a few moments depending on the size of the file and the speed of your internet connection.
Use the 3 dots icon far next to each uploaded file to update the name of the uploaded graphic or delete it.
Add a Device Graphic
To add a device graphic on device details follow the below steps:
Navigate to device details via the Site Homepage > Devices > search and select the desired Device from the device list.
To access the Device Graphic View, click on the Graphics icon at the bottom of the right sidebar.
From the Graphics View click on the "Apply Template" or “+ Create New'' button.
Selecting the "Apply Template" option you will have the chance to choose any saved device graphic template (the Device Graphic File and all the selected points/icons).
Selecting the “+ Create New'' option you can create a new device graphic from scratch.
From the “Choose File” pop-up widow select the Device Graphic File, uploaded on the Admin section.
Place the points/icons on the graphic in the desired location.
Use the "Save" button to save your changes and exit edit mode.
Edit and Add Points to the Device Graphic
To edit the Device Graphic and add points and icons, follow these steps:
Log in to your account and navigate to the Device Graphic dashboard.
Click on the "Edit Graphic" button to enter edit mode.
Clicking on the 3 dots icon at the top right of the screen on the drop down you will see three options:
Change File - from here you can change the deice graphic file.
Create Template - from here you can create template using the file you have uploaded and the points you have chosen.
Delete Graphic - from here you can delete the uploaded device graphic.
On the left side of your screen you will see the list of all Referenced Devices.
Drag points or devices from the list on the left to add new points and icons to the graphic.
You can zoom in to get more precise.
You can modify the placement of the device/point by dragging on the marker triangle.
Select the type of icon you want to add from the available options.
To learn more about Icons and Graphic Tool check this article here.
Click on the marker or icon to customize the appearance and settings of each point and icon, such as its name, color, size, and associated data.
Use the "Save" button to save your changes and exit edit mode.
Related Articles
Graphic Tool Settings
In the settings of Graphic Tools (Global Configuration) you can find everything that is needed to configure like Layers, Smart Markers, Icons and also here you can upload different graphic files for floor plans, devices and systems to use later while ...Table View and Device Details Export
You usually monitor device performance, status, history, and interact with devices to increase optimum performance, but what if you could also view the device history as a table or line chart and export it as a CSV file instead? With the data ...Navigating through Device Details
Device Details helps you to determine device performance, status, history and allows you to interact with devices in order to adjust their functioning with the aim of increasing optimum performance. There are a few ways on how you can get to device ...Mass Write Points
Introducing Mass Write Points The new "Mass Write Points" feature enhances building management by allowing users to write multiple points simultaneously across a building or an entire portfolio. This capability is particularly useful for various ...Device Graphics
The Graphics module also has an option to create a New Device Graphic directly within the tool. You can also create Templates that can be applied to a Device in Device Details or on Device Batch Update. Accessing the Device Graphic To create a ...