Graphic Enhancement Features
On the left side of the floor plan edit mode there is a list of Devices which you can drag and drop onto the floor plan. Also, you can use filters to select proper devices based on what purpose you want your graphic to serve.

Selecting Points for Display and “Hover-Over” on Markers
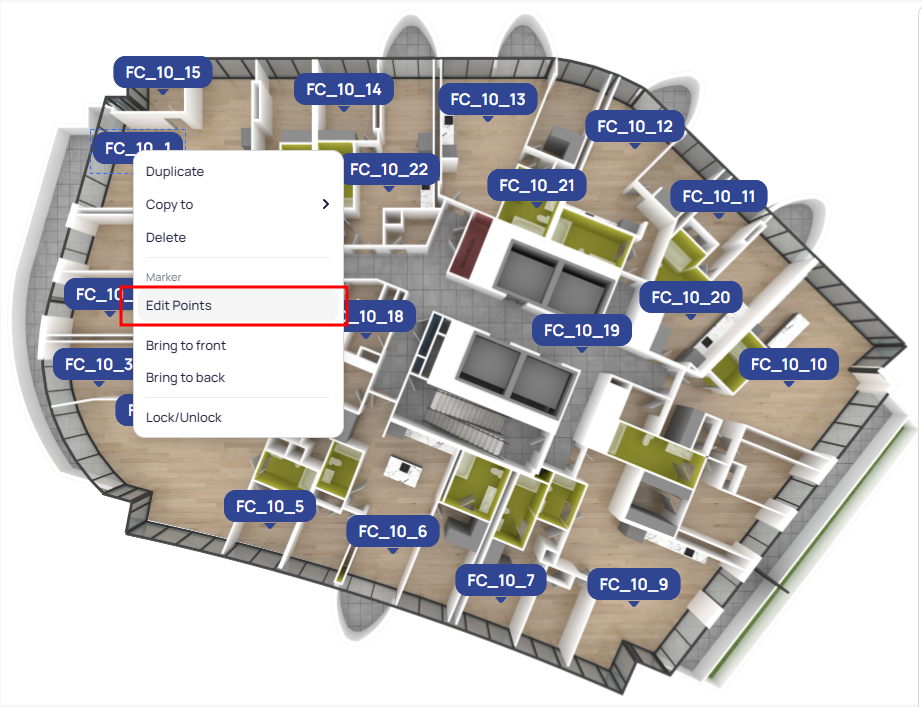
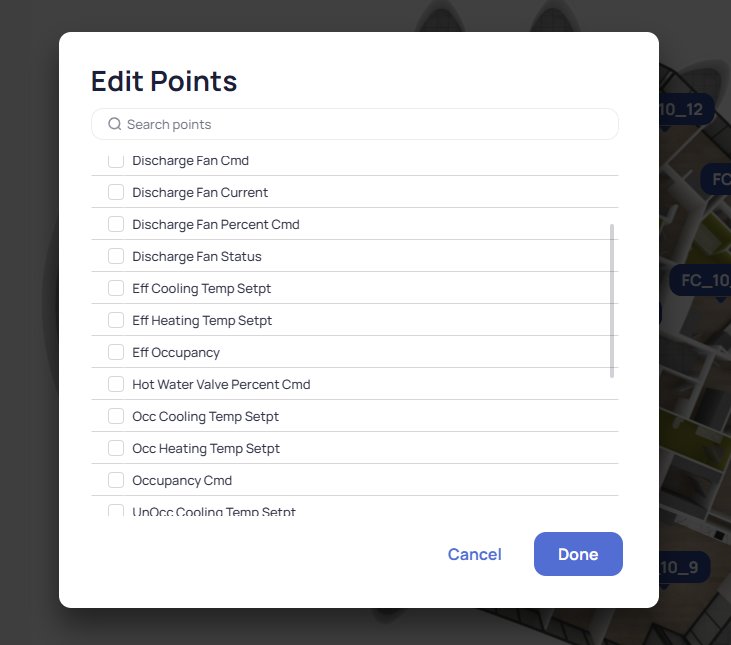
To select which point(s) will be available on the selected marker, right click on the marker, go to “Edit Points”, and select the point(s) you want to be associated with that marker:
After that the marker will change its appearance to show the points selected:
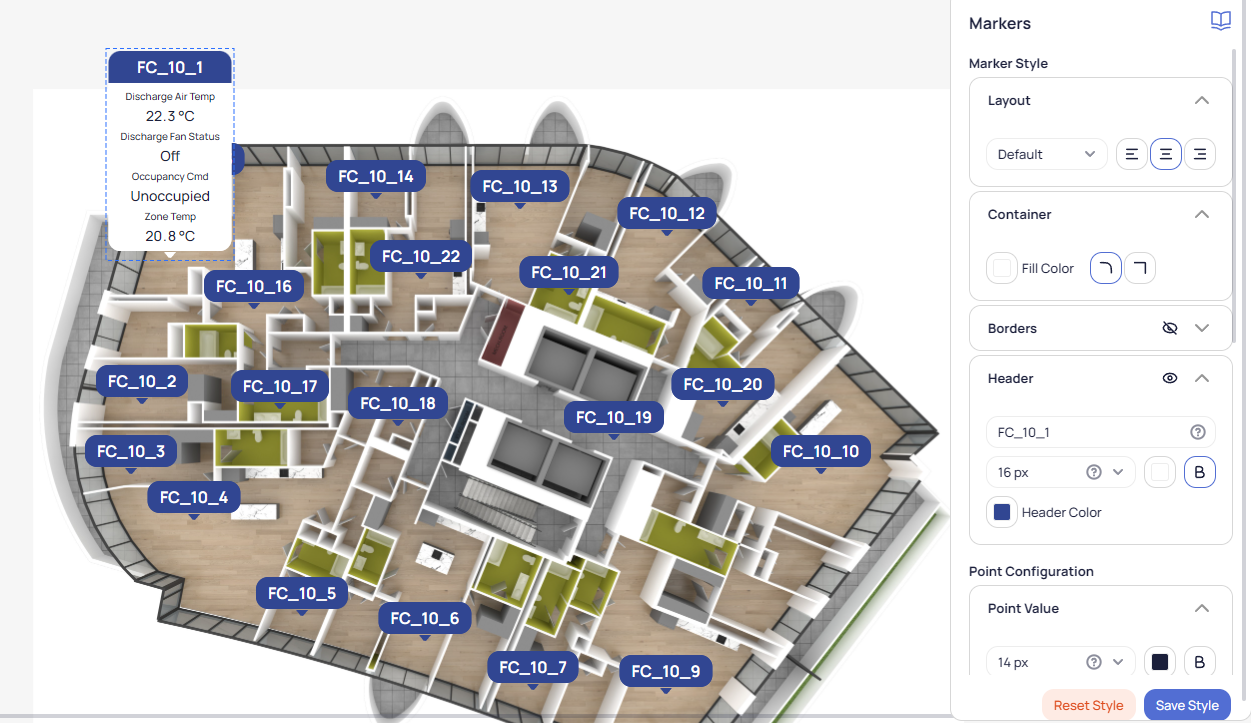
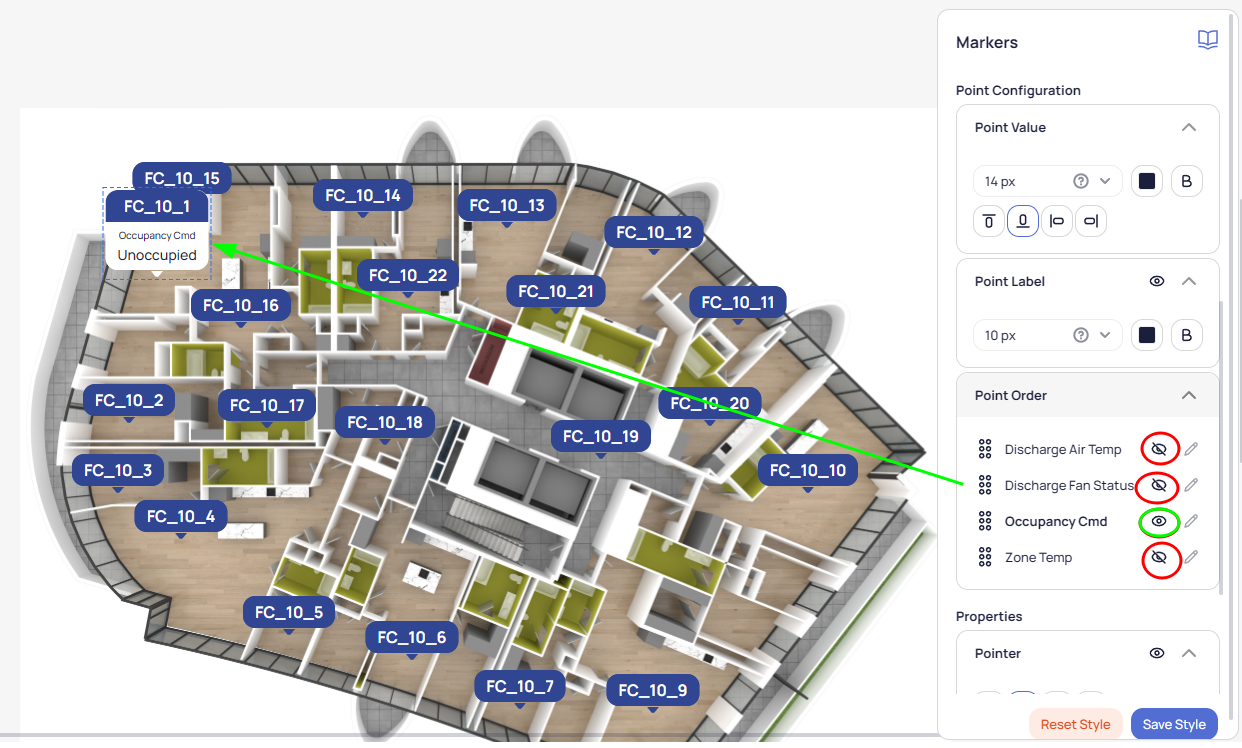
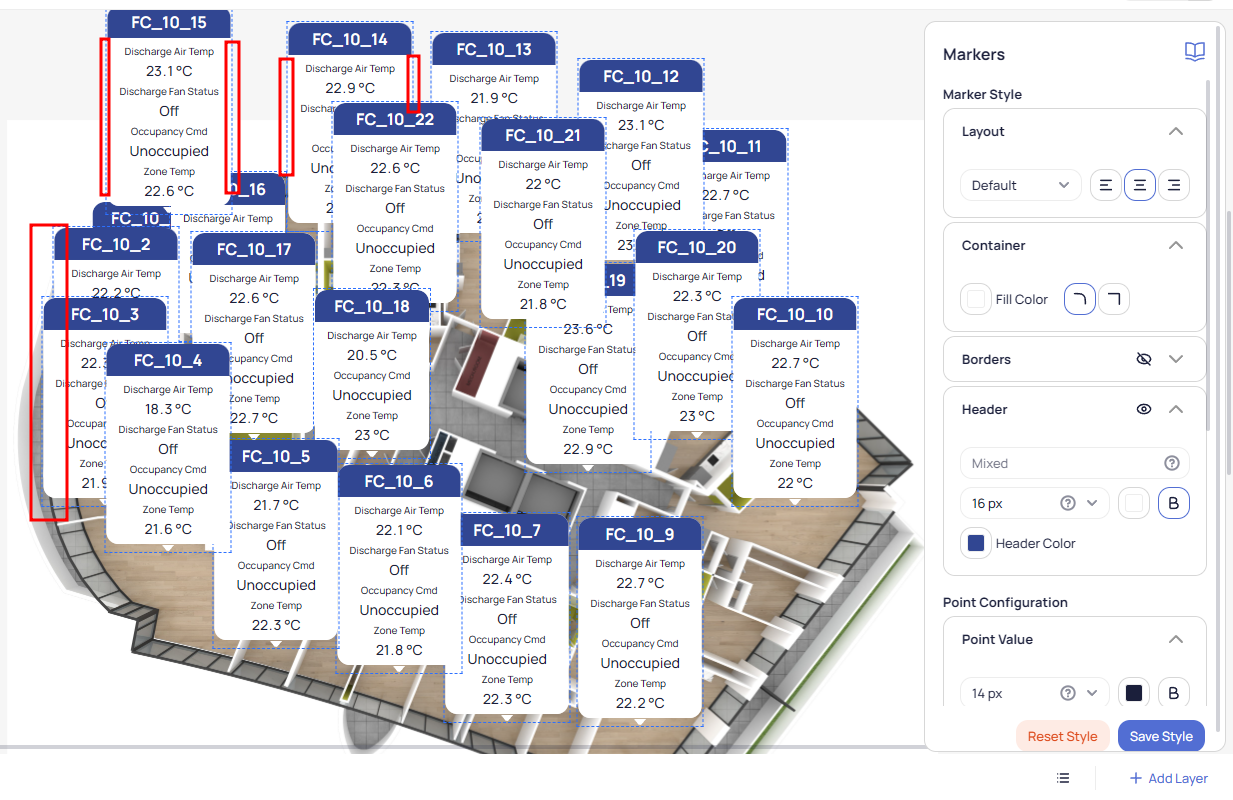
While you have a marker selected, you can explore the right-hand menu panel to customize its appearance and behavior. Here you can control fonts, colors, borders and other attributes. You can also arrange the order in which points are displayed. If you want to display the marker(s) in a more minimalistic way, you can enable the feature called Hover-over Markers. Just “hide” the points that you don’t want to be displayed as default, and when a user hovers over the marker with their cursor the other point values will be shown:

Batch edit/update
If you have a lot of markers in your floor plan, the Batch edit/update feature in the KODE OS Graphics module l can be very useful. Select a group of markers by using the (pressing) SHIFT key and clicking on the desired markers, or simply click and drag with a mouse and the markers in that region will be selected. Now any changes made on the right-hand menu will affect all the selected markers:
Smart Markers
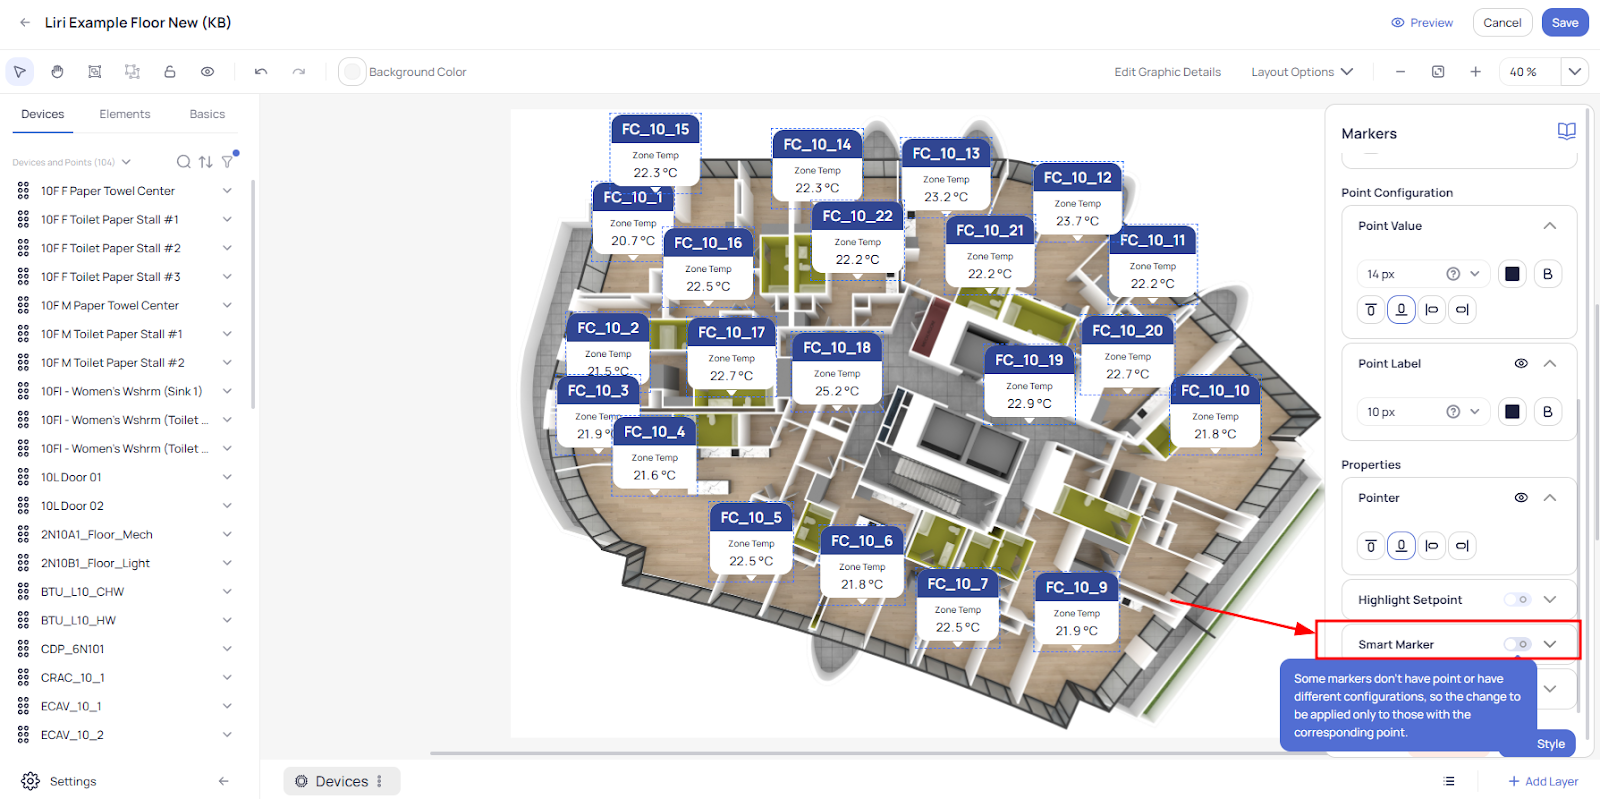
You can also activate the Smart Marker feature while on a selected marker (or group ofl markers selected now using multi-select option). This feature is enabled on the right-hand menu at “Smart Marker”.
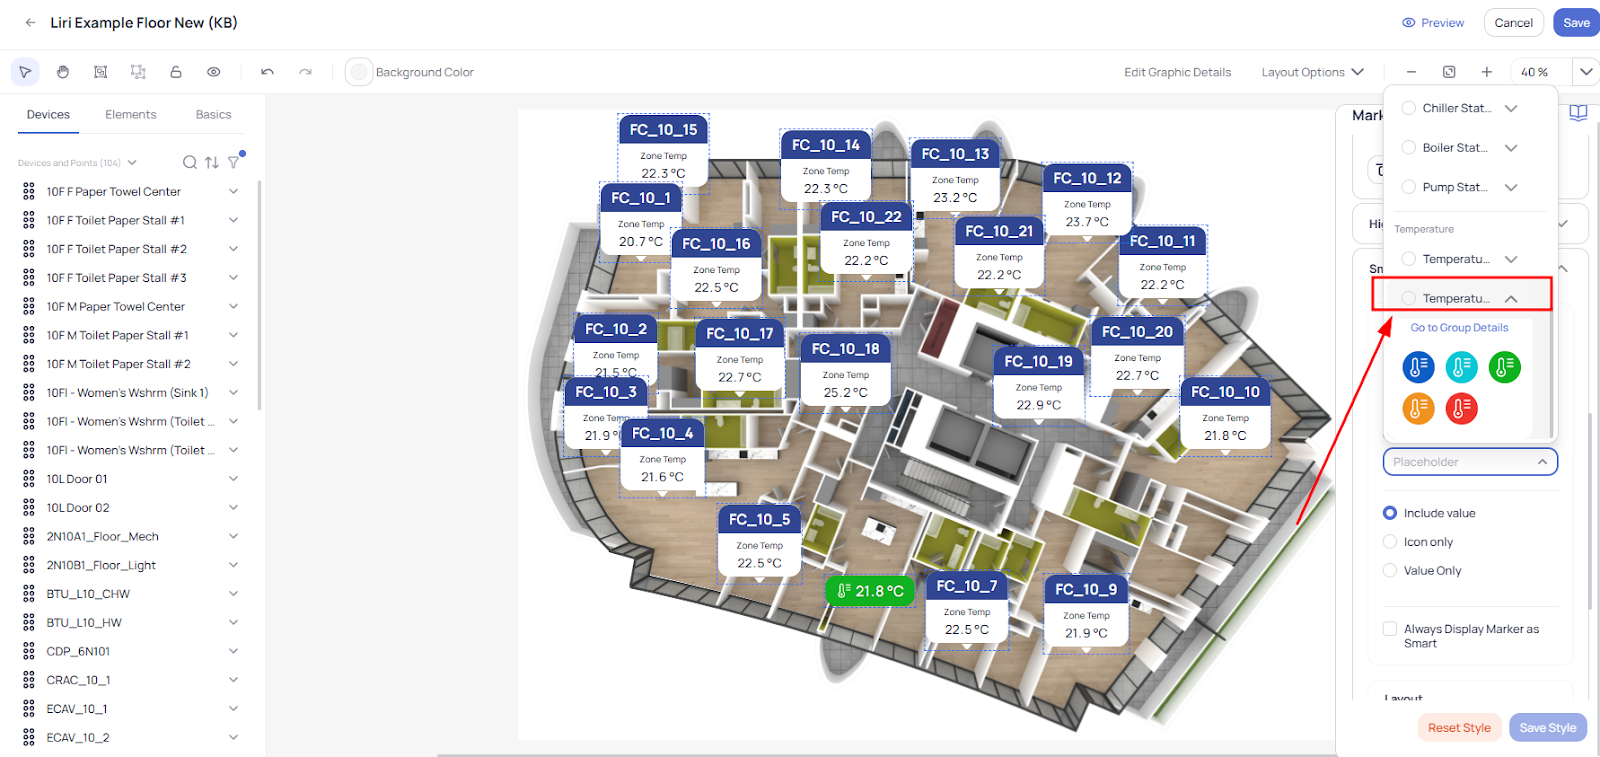
After enabling this feature you need to select the Point under Ontology Type where the smart marker will respond. In this case we have selected the “Zone Temperature” point, and after that we also associate the Icon Set for the Smart Marker to interact with based on the values of the point.
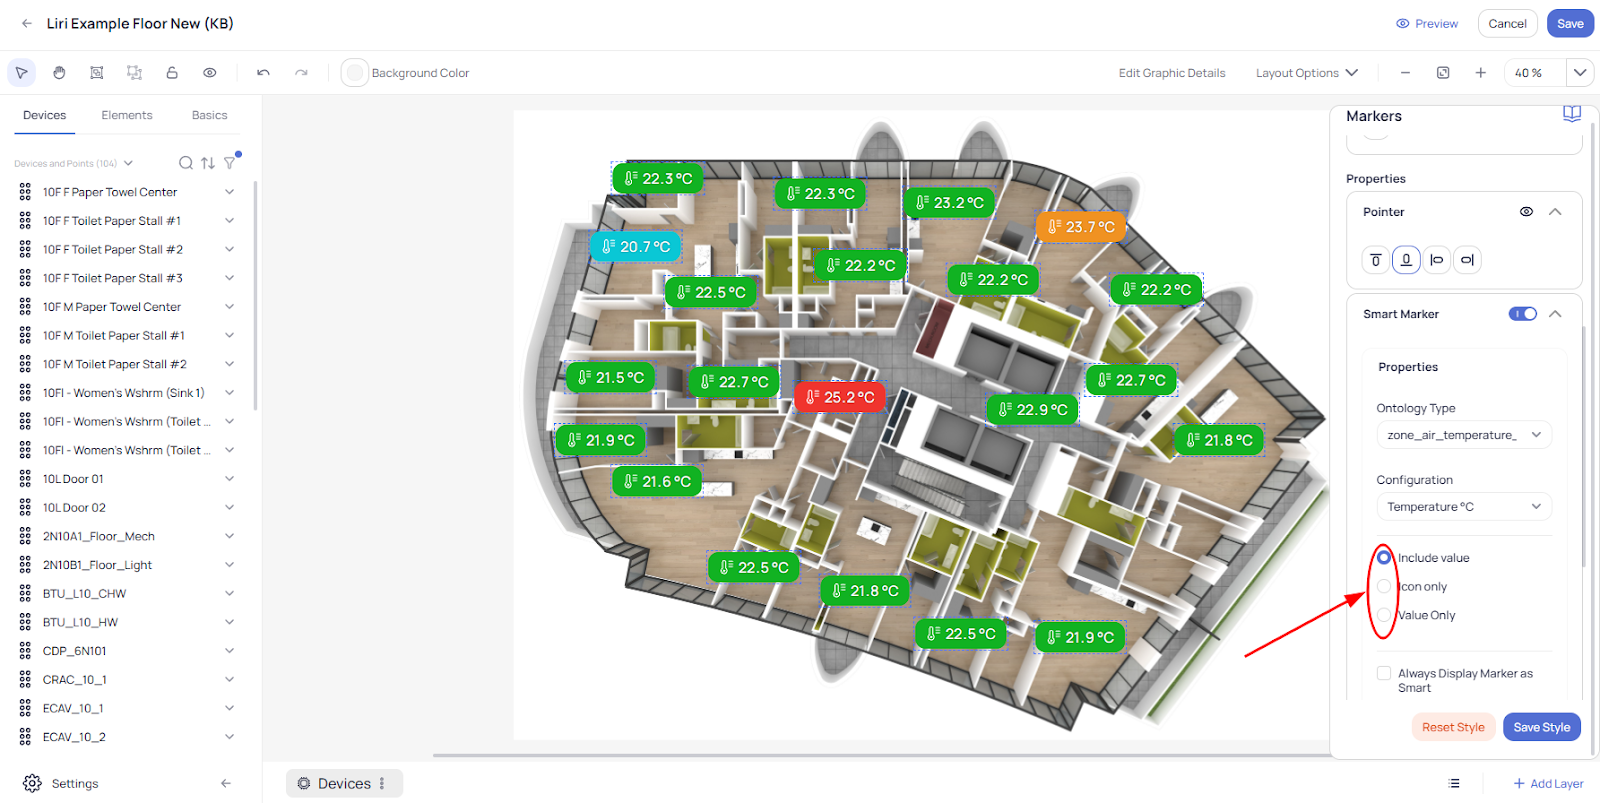
As you can see in the example above, the marker appearance will change, and you can choose one of three styles: Include Value, Icon Only or Value Only.
You can also save this style for future use by clicking on Save Style and giving it a name on the next dialog window.
Creating new Layer
Layers are a powerful convenience feature for the user, enabling multiple different views of data to be structured for simple navigation using the layer tabs at the top of the Area graphic.
If you want to create a new layer for the floor plan, simply click on the “Add Layer” button at the bottom right corner of the graphic.
On the next window you have to give a Name for the Layer. You can also associate an Icon for the layer you are creating. One powerful feature at this step is the ability to “Import devices from another layer”. This will eliminate the need to add drag-and-drop Devices again to the floor plan. The “Import devices from another layer” process will use the positions of the Devices as they are placed in the layer from which you import them.

In this case you are importing Devices from the “Devices” layer you created previously, and
click Done to save.
As you can see now you created a new Temperature Layer.


Note that Device positions can be changed from layer to layer if appropriate, for example if it is desired to show the Zone Temperature at the thermostat location on the Temperature layer, while showing the actual terminal units at their installed locations on the Devices layer.
Basic elements/shapes and Zones
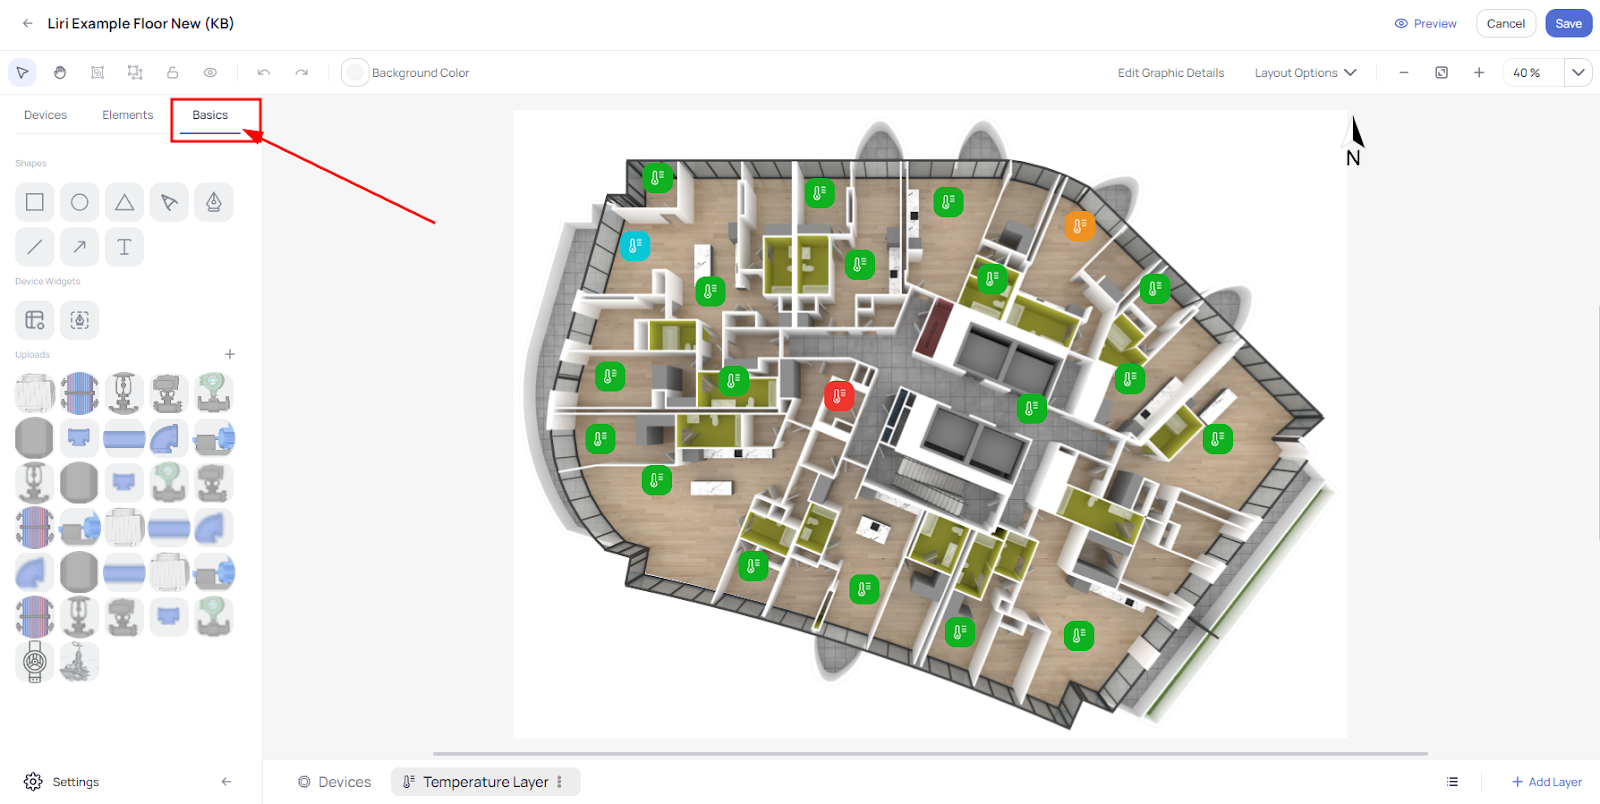
Graphics of all kinds can be annotated with various shapes and elements found in the “Basics” tab of the left-hand menu.
You also can draw Zones to show, for example, the portion of a floor affected by a specific device on the selected Layer, and configure States to define how Zone Color interacts with the value of the selected Device’s point.
To do that simply navigate on your left side menu to the “Basics” pane.
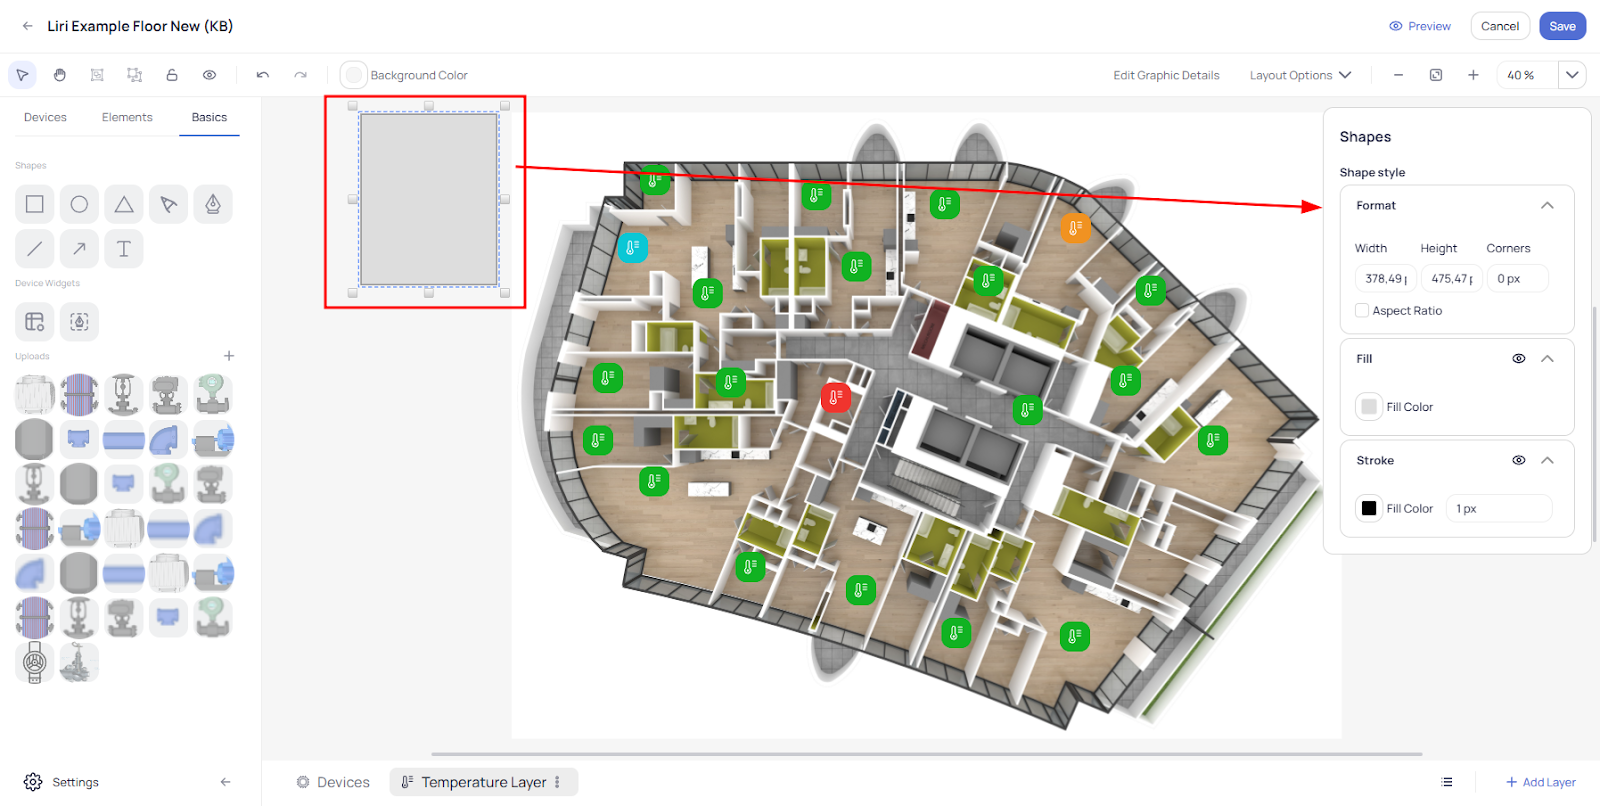
On this pane you will see some shapes that may be handy. Simply drag and drop them onto the graphic. Each of them has options that you can adjust based on your needs.
Drawing Zones
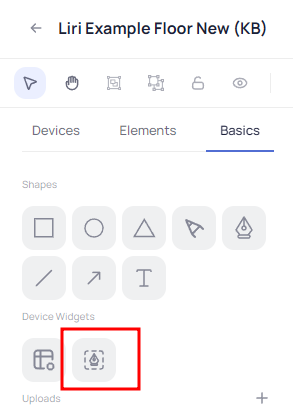
To continue with drawing Zones simply go to the Device Widgets Group and click on “Zone Tool”:
Next, you can define the shape of your Zone by clicking around the perimeter, being sure to capture all angles, corners and curves, outlining your Zone like a polygonal lasso tool.
When you have finished outlining the Zone, deselect the Zone Tool in the left-hand menu or click the ESC key on the keyboard.After you finish drawing a Zone you can select the Zone, and on the right side the Zone Menu will appear. There you can configure which Device and Point you want the Zone to interact with. You can also set one or more States defining how or at what values you like the Zone to change color.

When you right click on a Zone, or on other Elements you added/created, an index menu will be shown where you can Duplicate, Copy to, Delete, etc. This can be very helpful when you are creating multiple layers or zones.
For example, you can duplicate this Zone and then re-shape and position it appropriately for another region of the floor plan. Then just change the Device and Point values and keep the State of the original Zone.
When you select the duplicated zone simply double click on little white squares to delete the pin of a line to match the new zone:

Device Tables
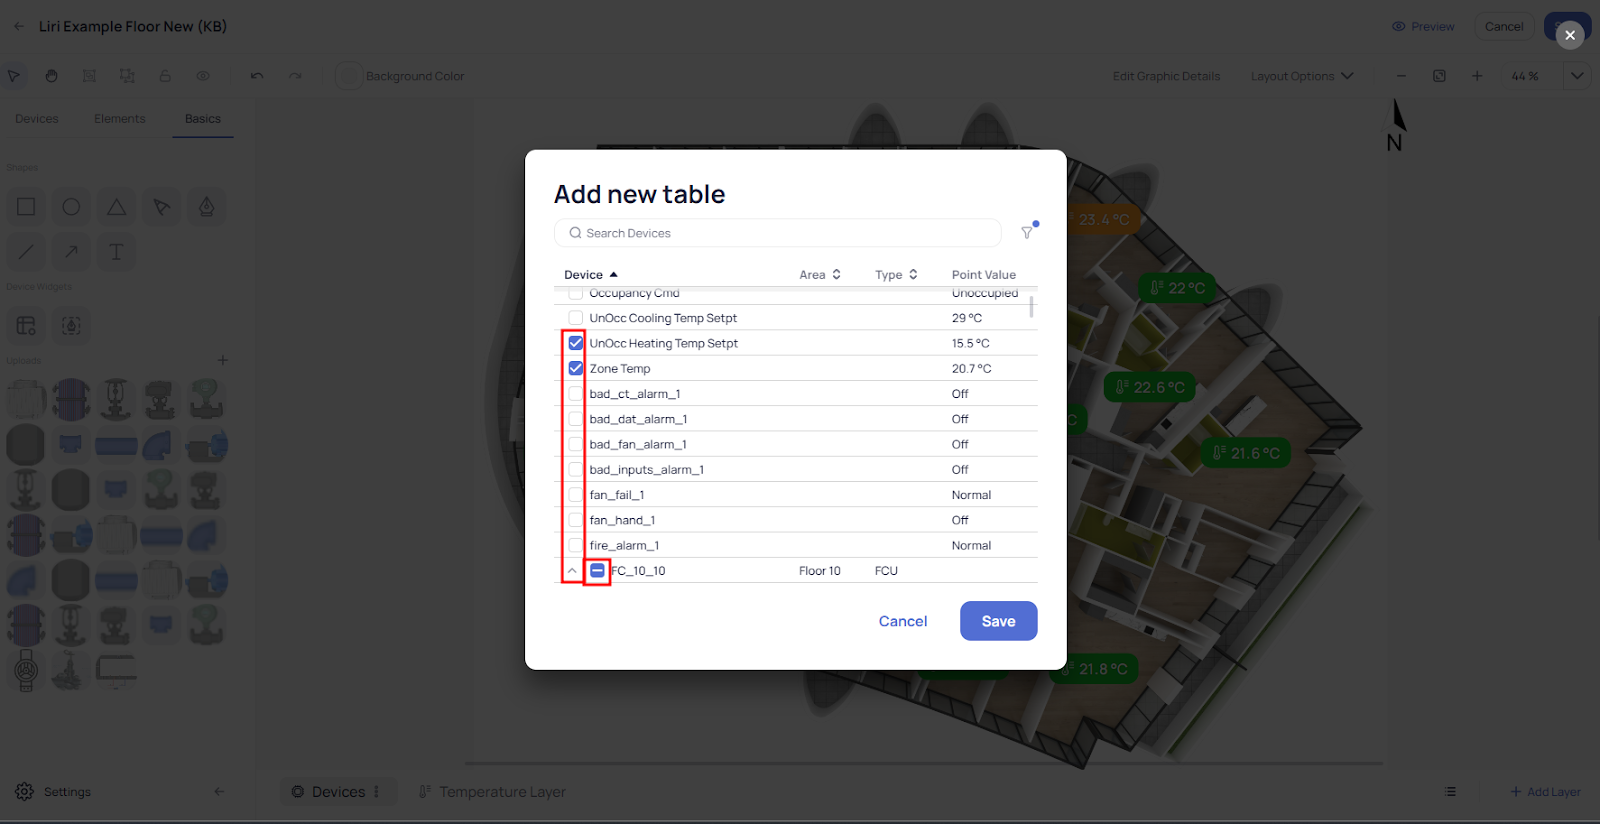
To add a Device Table, simply drag and drop it from the Basics menu in the left-hand menu pane:
After you drop it onto your graphic, a pop up window will appear where you can select which Device(s) and which Point(s) you want to include in the table.

You can then select the table and customize it using the options on the right-hand menu. This menu also has an option to highlight the Setpoint:
Related Articles
Device Graphic
Device Graphic is a powerful tool for visualizing your building's HVAC system in real time. It allows you to monitor and control your AHU, VAV, and HVAC devices and their components, all from a single interface. Overall, Device Graphic is an ...System and Floor Plan Graphic Customization
You can add texts into floor plans with different fonts, draw custom shapes using the pen tool, add images and different colors to create gorgeous graphics that you can customize with powerful features. You can enhance the design of a layout in a ...Graphic Tool Settings
In the settings of Graphic Tools (Global Configuration) you can find everything that is needed to configure like Layers, Smart Markers, Icons and also here you can upload different graphic files for floor plans, devices and systems to use later while ...Graphics Summary
Module summary We’re thrilled to announce that Graphics creation as we know it has been completely transformed. There’s a graphics builder we’ve been cooking that gives you the ability to build System and Device Graphics and customize floor plans ...Floor Plans Options and Features
Once you are in the Floor Plan view you will be prompted with several options and features that you can benefit in order to enhance your experience. Depending on the type of devices in a building, on the floor plan widget, you will see tabs for each ...